What Do You Know About the Graph of Reciprocal Functions?
Introduction
The graph of reciprocal functions is an important topic in mathematics because it helps students understand the relationship between a variable and its reciprocal. Reciprocal functions are commonly used to study inverse relationships, coordinate graphs, and changes in mathematical quantities.
In this article, you will learn the definition of a reciprocal function, its general formula, the properties of its graph, and how to draw the graph step by step. You will also find solved examples, practical applications, common mistakes, and practice questions.
These explanations can help students strengthen their understanding of functions and prepare for mathematics assessments.
What Is a Reciprocal Function?
A reciprocal function is a function in which the variable appears in the denominator of a fraction. The simplest reciprocal function is:
Here, is the independent variable and is the dependent variable.
For every non-zero value of , the value of is the reciprocal of .
For example:
- If , then .
- If , then .
- If , then .
- If , then .
The value is not allowed because division by zero is undefined.
General Formula of a Reciprocal Function
A common form of a reciprocal function is:
where is a non-zero constant.
The value of affects the position and shape of the graph.
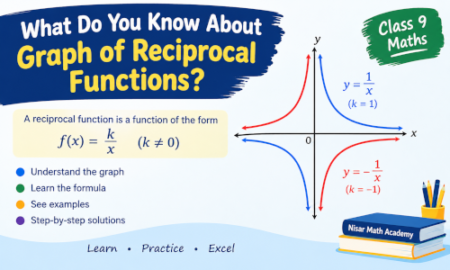
- If , the graph has branches in the first and third quadrants.
- If , the graph has branches in the second and fourth quadrants.
A more general reciprocal graph may be written as:
In this form, and shift the graph horizontally and vertically, respectively.
Properties of the Graph of Reciprocal Functions
Consider the basic reciprocal function:
Its main properties are explained below.
1. Domain
The domain is the set of all permitted values of .
Since division by zero is undefined, cannot equal zero.
Therefore, the domain is:
2. Range
The range is the set of possible values of .
The expression can never equal zero. Therefore:
3. Shape of the Graph
The graph of is called a rectangular hyperbola.
It consists of two separate curved branches:
- One branch lies in the first quadrant.
- The other branch lies in the third quadrant.
The graph approaches both coordinate axes but never touches them.
4. Asymptotes
An asymptote is a straight line that a curve approaches increasingly closely.
For the graph of , the asymptotes are:
The line is the -axis, while is the -axis.
5. Intercepts
The graph has no -intercept because can never equal zero.
It also has no -intercept because the function is undefined at .
6. Symmetry
The graph of is symmetric about the origin.
This is because:
Such a function is called an odd function.
How to Draw the Graph of Reciprocal Functions
To understand how to draw the graph of reciprocal functions, follow these steps.
- Write the given function, such as .
- Prepare a table of values using positive and negative values of , excluding zero.
- Calculate the corresponding values of .
- Draw the horizontal -axis and vertical -axis.
- Plot the ordered pairs .
- Draw a smooth curve through the plotted points.
- Make sure the curve approaches the axes without touching them.
Table of Values for
| Ordered pair | ||
|---|---|---|
Diagram-Based Explanation
Imagine a coordinate plane with four quadrants.
- Plot and in the first quadrant.
- Plot and in the third quadrant.
- Join the points with two smooth curves.
- The first branch approaches the positive -axis and positive -axis.
- The third-quadrant branch approaches the negative sides of both axes.
The two branches never cross either axis. As the absolute value of increases, the absolute value of decreases.
Examples of Graphing Reciprocal Functions
The following solved examples explain how to calculate values, plot points, and identify important graph properties.
Example 1: Draw the Graph of
Solution
Step 1: Write the function.
Step 2: Prepare a table of values.
| Calculation | ||
|---|---|---|
Step 3: Plot the points obtained from the table.
Step 4: Draw two smooth branches through the points.
Answer: The graph is a rectangular hyperbola with branches in the first and third quadrants. Its asymptotes are and .
Example 2: Draw the Graph of
Solution
Step 1: Write the function.
Step 2: Calculate the values.
| Calculation | ||
|---|---|---|
Step 3: Plot the ordered pairs.
Step 4: Join the points with smooth curves.
Answer: The graph has branches in the first and third quadrants. Its asymptotes remain and .
Compared with , the graph of has larger absolute -values at the same non-zero -values.
Example 3: Draw the Graph of
Solution
Step 1: Write the function.
Step 2: Prepare a table.
| Calculation | ||
|---|---|---|
Step 3: Plot the points.
Step 4: Draw the two smooth branches.
Answer: The graph lies in the second and fourth quadrants. Its asymptotes are still and .
Changing the sign of the numerator reflects the basic graph across the -axis.
Example 4: Find the Value of When
Given:
Substitute :
Therefore:
The corresponding point is .
Example 5: Find When
Given:
Substitute :
Multiply both sides by :
Divide both sides by :
The corresponding point is .
Example 6: Identify the Asymptotes of a Transformed Reciprocal Function
Given:
Compare this with the general form:
Here, and .
Therefore, the vertical asymptote is:
The horizontal asymptote is:
The graph is shifted three units to the right and one unit upwards.
How Does the Constant Affect the Graph?
For the function:
the constant determines the graph’s orientation and vertical scale.
| Function | Quadrants | Asymptotes |
|---|---|---|
| I and III | ||
| I and III | ||
| II and IV | ||
| II and IV |
For positive , the branches lie in quadrants I and III. For negative , they lie in quadrants II and IV.
A larger value of gives larger values of for the same non-zero .
Real-Life Applications of Reciprocal Functions
Reciprocal relationships appear in several practical situations.
1. Speed and Time
For a fixed distance, travel time is inversely proportional to speed.
If the distance is kilometres, then:
where is time in hours and is speed in kilometres per hour.
At km/h:
At km/h:
This illustrates an inverse relationship for a fixed distance.
2. Work Rate
If one person can complete a job in hours, the work rate is:
This simple model assumes a constant rate of work.
3. Pressure and Volume
For a fixed amount of gas at constant temperature, pressure and volume can be inversely proportional under the ideal-gas model:
Here, is a constant.
These examples demonstrate why reciprocal relationships are useful in science and everyday calculations.
Common Mistakes Students Make
Students should avoid the following mistakes when graphing reciprocal functions.
- Substituting zero for xx: The expression is undefined when .
- Forgetting negative values: Both positive and negative values are needed to show the complete graph of the basic function.
- Drawing a straight line: The graph of is a hyperbola, not a straight line.
- Allowing the curve to touch an asymptote: The branches approach the axes but do not touch them.
- Confusing the quadrants: A positive numerator gives branches in quadrants I and III; a negative numerator gives branches in quadrants II and IV.
- Using incorrect reciprocals: The reciprocal of is , not .
- Ignoring transformations: In , the asymptotes are and .
Frequently Asked Questions
What is the graph of a reciprocal function?
It is the graph of a function such as , which forms a hyperbola with two separate branches.
Why can not be zero?
Because division by zero is undefined.
Does a reciprocal function cross the axes?
The basic function does not cross either coordinate axis.
Which quadrants contain the graph of ?
The first and third quadrants.
What are the asymptotes of ?
The vertical asymptote is , and the horizontal asymptote is .
How do you draw a reciprocal graph?
Choose non-zero -values, calculate , plot the points, and draw smooth branches that approach the asymptotes.
Where can students find more mathematics learning resources?
Students can explore Nisar Math Academy for mathematics lectures, notes, assessments, worksheets, and other learning materials. Some resources are free, while additional course materials are available through membership.
Conclusion
The graph of reciprocal functions helps students understand how a variable and its reciprocal are related. The basic function forms a rectangular hyperbola, has two branches in quadrants I and III, and approaches the coordinate axes without touching them.
To draw the graph accurately, calculate a suitable table of values, plot the points carefully, identify the asymptotes, and sketch smooth curves. Practising different forms, such as and , makes it easier to understand changes in orientation and scale.
Regular practice with solved examples, mathematics notes, and assessments can improve students’ confidence and graphing skills.
You May be Interested In:
Graph of Cubic Functions: Definition, Examples, and Solved Questions
Graph of Quadratic Functions: Definition, Formula, Examples and Graphs
What Do You Know About Graph of Linear Functions? Definition, Examples, Formulas and Graphs

Leave a Reply