Graph of Quadratic Functions: Definition, Formula, Examples and Graphs
Introduction
A quadratic function is a function in which the highest power of the variable is 2. The graph of a quadratic function has a special curved shape called a parabola.
Understanding the graph of quadratic functions is important because it helps students identify the vertex, axis of symmetry, intercepts, maximum or minimum value, and the general shape of a quadratic function.
In this article, you will learn:
- What a quadratic function is
- What the graph of a quadratic function looks like
- How to find the vertex
- How to find the axis of symmetry
- How to find x- and y-intercepts
- How to sketch a quadratic graph step by step
- How to solve examples involving quadratic function graphs
- Common mistakes students should avoid
- Practical applications of quadratic functions
These concepts are particularly useful for students studying Class 9 Maths and preparing for examinations.
What Is a Quadratic Function?
A quadratic function is generally written as:
where:
Here:
- , , and are constants.
- is the variable.
- is the quadratic term.
- is the linear term.
- is the constant term.
For example:
is a quadratic function because the highest power of is 2.
Another example is:
What Does the Graph of a Quadratic Function Look Like?
The graph of a quadratic function is called a parabola.
The direction in which the parabola opens depends on the value of .
When
If is positive, the parabola opens upward.
For example:
has an upward-opening parabola.
Its graph has a minimum point.
When
If is negative, the parabola opens downward.
For example:
has a downward-opening parabola.
Its graph has a maximum point.
Diagram-based explanation
Imagine a coordinate plane with the -axis horizontal and the -axis vertical.
For:
the graph passes through points such as:
When these points are joined smoothly, they form a U-shaped parabola.
For:
the corresponding points include:
The parabola opens downward.
Important Parts of a Quadratic Graph
Several important features can be identified from a quadratic graph.
1. Vertex
The vertex is the turning point of a parabola.
For an upward-opening parabola, the vertex is the lowest point.
For a downward-opening parabola, the vertex is the highest point.
For:
the x-coordinate of the vertex is:
After finding , substitute it into the function to find the y-coordinate.
Therefore, the vertex is:
2. Axis of Symmetry
The axis of symmetry is the vertical line that divides the parabola into two equal mirror-image parts.
Its equation is:
The axis of symmetry always passes through the vertex.
3. y-Intercept
The y-intercept is the point where the graph crosses the y-axis.
On the y-axis:
Therefore:
So the y-intercept of:
is:
4. x-Intercepts
The x-intercepts are the points where the graph crosses or touches the x-axis.
On the x-axis:
Therefore, we solve:
The solutions of this equation give the x-coordinates of the x-intercepts.
Important Formulas for Quadratic Functions
For:
the following formulas are useful.
| Quantity | Formula |
|---|---|
| General form | |
| Vertex x-coordinate | |
| Axis of symmetry | |
| y-intercept | |
| x-intercepts | Solve |
| Quadratic formula |
The expression:
is called the discriminant.
How Does the Discriminant Affect the Graph?
The discriminant helps us determine how many x-intercepts a quadratic graph has.
If
There are two distinct real roots.
Therefore, the parabola crosses the x-axis at two different points.
If
There is one repeated real root.
The parabola touches the x-axis at exactly one point.
If
There are no real roots.
Therefore, the parabola does not meet the x-axis.
How to Sketch Graph of Quadratic Functions
To sketch graph of quadratic functions, follow these steps.
Step 1: Write the function
Suppose:
Step 2: Identify , , and
Comparing with:
we get:
Step 3: Determine the direction of opening
Since:
the parabola opens upward.
Step 4: Find the axis of symmetry
Use:
Therefore:
So the axis of symmetry is:
Step 5: Find the vertex
Substitute :
Therefore, the vertex is:
Step 6: Find the y-intercept
Put:
Then:
So the y-intercept is:
Step 7: Find the x-intercepts
Put:
Therefore:
Factorize:
Thus:
The x-intercepts are:
Step 8: Plot the points
Important points are:
- Vertex:
- y-intercept:
- x-intercepts: and
Plot these points on the coordinate plane and draw a smooth upward-opening parabola.
Notice that the points and are equally distant from the axis:
This demonstrates the symmetry of the parabola.
Example 1: Graph of
Consider:
Create a table of values.
| -3 | 9 |
| -2 | 4 |
| -1 | 1 |
| 0 | 0 |
| 1 | 1 |
| 2 | 4 |
| 3 | 9 |
Plot these points on the coordinate plane.
The graph is a parabola opening upward.
The vertex is:
The axis of symmetry is:
The graph is symmetric about the y-axis.
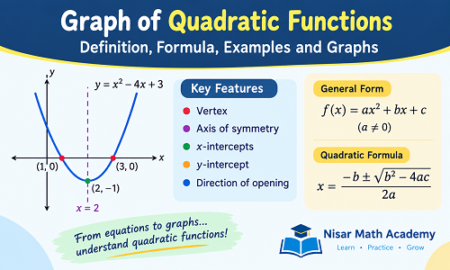
Example 2: Example of Quadratic Function With Solution and Graph
Consider:
Step 1: Identify the coefficients
Step 2: Find the axis of symmetry
Step 3: Find the vertex
Substitute :
Therefore:
Step 4: Find the x-intercepts
Set :
Factorize:
Thus:
The x-intercepts are:
Step 5: Find the y-intercept
Put :
Therefore:
Graph description
The graph is an upward-opening parabola with:
- Vertex at
- Axis of symmetry
- x-intercepts at and
- y-intercept at
A table of values can also be used to obtain additional points.
| 0 | 8 |
| 1 | 3 |
| 2 | 0 |
| 3 | -1 |
| 4 | 0 |
| 5 | 3 |
| 6 | 8 |
These values clearly show the symmetry about .
Example 3: Downward-Opening Quadratic
Consider:
Here:
Since , the parabola opens downward.
Find the vertex
Here:
Therefore:
Now substitute :
Therefore, the vertex is:
Since the parabola opens downward, this vertex represents the maximum point.
Example 4: Finding the Vertex From Vertex Form
A quadratic function can also be written in vertex form:
In this form, the vertex is immediately visible:
Consider:
Comparing with:
we get:
Therefore, the vertex is:
Since:
the parabola opens upward.
The axis of symmetry is:
Standard Form and Vertex Form
Quadratic functions are commonly written in two useful forms.
Standard Form
This form is useful for identifying , , and , and for finding the y-intercept.
Vertex Form
This form makes the vertex easy to identify.
The vertex is:
How Can We Tell the Shape of a Quadratic Graph?
The coefficient controls the direction and width of the parabola.
Direction
- : opens upward
- : opens downward
Width
If the absolute value of is large, the parabola is narrower.
If:
the parabola is wider than the basic graph .
For example:
is narrower than:
while:
is wider.
Transformations of a Quadratic Graph
Starting with:
we can understand changes in the graph.
Vertical shift upward
moves the graph 3 units upward.
Vertical shift downward
moves the graph 3 units downward.
Horizontal shift right
moves the graph 2 units to the right.
Horizontal shift left
moves the graph 2 units to the left.
Reflection
reflects the graph of across the x-axis.
Real-Life Applications of Quadratic Functions
Quadratic functions are useful in many mathematical and real-world situations.
Projectile Motion
When an object is thrown upward, its height can often be represented by a quadratic function, assuming air resistance is ignored.
The graph can help determine:
- Maximum height
- Time to reach maximum height
- Time when the object reaches the ground
Area Problems
Quadratic equations can occur when finding dimensions of rectangles or other shapes when their area or perimeter is known.
Engineering and Design
Parabolic shapes are used in some structures and designs because of their mathematical properties.
Economics
Quadratic functions can sometimes be used to model relationships involving revenue, cost, or profit in simplified mathematical models.
Common Questions About Quadratic Graphs
Is every quadratic graph a parabola?
Yes. The graph of a quadratic function with a non-zero quadratic coefficient is a parabola.
How do I know whether a parabola opens upward or downward?
Look at in:
If , it opens upward.
If , it opens downward.
How do I find the vertex?
Use:
Then substitute this x-value into the function to find the y-coordinate.
How do I find the y-intercept?
Put:
The resulting y-value gives the y-intercept.
How do I find the x-intercepts?
Put:
and solve the resulting quadratic equation.
Common Mistakes Students Make
1. Forgetting the negative sign
Students sometimes incorrectly use:
instead of:
2. Confusing the vertex with the y-intercept
The y-intercept occurs when . It is not necessarily the vertex.
3. Drawing a straight line
A quadratic function does not produce a straight-line graph. Its graph is a parabola.
4. Using incorrect signs
For example, if:
then:
Students should carefully preserve the negative sign.
5. Forgetting symmetry
A parabola is symmetric about its axis of symmetry. This property can help students check whether their plotted points are correct.
6. Plotting inaccurate points
Always calculate the y-values carefully before plotting them.
How to Check Your Quadratic Graph
After drawing a graph, check the following:
- Is the parabola opening in the correct direction?
- Is the vertex correct?
- Is the axis of symmetry correct?
- Is the y-intercept correct?
- Are the x-intercepts correct?
- Are symmetric points equally distant from the axis?
- Does the graph pass through the calculated points?
These checks can help identify calculation or plotting errors.
Quadratic Functions and Class 9 Mathematics
Quadratic functions are an important part of school mathematics because they connect algebraic expressions with graphical representations.
Students can improve their understanding by combining:
- Definitions
- Formulas
- Tables of values
- Graphs
- Factorization
- Solved examples
- Practice questions
Students looking for class 9 maths notes, class 9 maths notes PDF, solved questions, assessments, and recorded lessons can also explore the learning resources available through Nisar Math Academy. The academy provides mathematics notes, recorded video lectures, worksheets, assessments, lesson plans, and other learning resources for students.
Short Conclusion
The graph of quadratic functions is a parabola. The general form of a quadratic function is:
The sign of determines whether the parabola opens upward or downward. The vertex and axis of symmetry help us understand its position and shape, while the x- and y-intercepts help us locate where the graph meets the coordinate axes.
The most important formula for finding the vertex is:
By identifying these features and plotting suitable points, students can sketch quadratic graphs accurately and confidently.
3. Short Notes for Revision
Definition
A quadratic function is a function of the form:
Graph
The graph of a quadratic function is called a parabola.
Direction
- → parabola opens upward
- → parabola opens downward
Vertex
Then substitute this x-value into the function to find .
Axis of Symmetry
y-Intercept
Put:
For , the y-intercept is:
x-Intercepts
Put:
and solve:
Quadratic Formula
Discriminant
- → two real roots
- → one repeated real root
- → no real roots
Vertex Form
Vertex:
Important Reminder
A parabola is symmetric about its axis of symmetry.
4. MCQs
MCQ 1
Which of the following is a quadratic function?
A.
B.
C.
D.
Correct Answer: B
MCQ 2
What is the general form of a quadratic function?
A.
B.
C.
D.
Correct Answer: C
MCQ 3
What is the graph of a quadratic function called?
A. Circle
B. Line
C. Parabola
D. Hyperbola
Correct Answer: C
MCQ 4
If , a quadratic parabola opens:
A. Downward
B. Upward
C. Left
D. Right
Correct Answer: B
MCQ 5
If , the parabola:
A. Opens upward
B. Opens downward
C. Becomes a straight line
D. Has no graph
Correct Answer: B
MCQ 6
What is the axis of symmetry of ?
A.
B.
C.
D.
Correct Answer: B
MCQ 7
The vertex of is:
A.
B.
C.
D.
Correct Answer: A
MCQ 8
What is the y-intercept of ?
A.
B.
C.
D.
Correct Answer: C
MCQ 9
For , the parabola opens:
A. Upward
B. Downward
C. Left
D. Right
Correct Answer: B
MCQ 10
If the discriminant is zero, a quadratic equation has:
A. Two distinct real roots
B. No real roots
C. One repeated real root
D. Three roots
Correct Answer: C
MCQ 11
What is the vertex form of a quadratic function?
A.
B.
C.
D.
Correct Answer: B
MCQ 12
The x-intercepts of a quadratic graph are found by putting:
A.
B.
C.
D.
Correct Answer: C
MCQ 13
The vertex of is:
A.
B.
C.
D.
Correct Answer: C
MCQ 14
For , the value of is:
A. 0
B. 1
C. 2
D. 3
Correct Answer: D
MCQ 15
The graph of has its vertex at:
A.
B.
C.
D.
Correct Answer: B
5. Worksheet / Assignment
Part A: Definitions and Concepts
- Define a quadratic function.
- What is the general form of a quadratic function?
- What is the graph of a quadratic function called?
- State the condition under which a parabola opens upward.
- State the formula for the axis of symmetry of .
Part B: Short Questions
- Find the vertex of:
- Find the y-intercept of:
- Determine whether the parabola opens upward or downward:
- Find the x-intercepts of:
- Find the vertex and axis of symmetry of:
Part C: Graphing Problems
- Make a table of values and sketch the graph of:
Use at least five suitable x-values.
- Sketch the graph of:
Identify:
- Vertex
- Axis of symmetry
- x-intercepts
- y-intercept
- Sketch the graph of:
Identify the vertex and direction of opening.
Part D: Word Problem
- The height of an object is represented by:
where represents time.
Find the maximum height of the object.
- A quadratic function is given by:
Find its vertex, axis of symmetry, and x-intercepts.
Worksheet Answer Key
- A function of the form , where .
- Parabola.
- When .
- Vertex:
- y-intercept:
- Since , it opens downward.
x-intercepts:
Vertex:
Axis:
- For , suitable points include:
Vertex:
Vertex:
Axis:
x-intercepts:
y-intercept:
The parabola opens downward.
Vertex:
Maximum height:
Axis:
Vertex:
Vertex:
For x-intercepts:
Therefore:
x-intercepts:
6. Frequently Asked Questions
What is a quadratic function?
A quadratic function is a function whose highest power of the variable is 2. Its general form is:
What is the graph of a quadratic function?
The graph of a quadratic function is called a parabola.
How do you find the vertex of a quadratic function?
For:
first calculate:
Then substitute this x-value into the function to obtain the y-coordinate.
How do you find the axis of symmetry?
The axis of symmetry is:
How do you know whether a parabola opens upward or downward?
If , it opens upward. If , it opens downward.
How do you find the x-intercepts?
Set and solve:
How do you find the y-intercept?
Set . For , the y-intercept is .
What is vertex form?
Vertex form is:
The vertex is .
You May be Interested In:
What Do You Know About Graph of Linear Functions? Definition, Examples, Formulas and Graphs
Functions and Their Graphs: Definition, Types, Examples and Basic Graphs
Applications of Polygons: Uses of Polygons in Our Life with Examples

Leave a Reply