Graph of Cubic Functions: Definition, Examples, and Solved Questions
Introduction
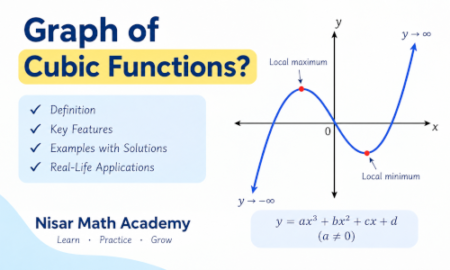
The graph of cubic functions is an important topic in algebra. A cubic function is a polynomial function in which the highest power of the variable is 3. Its graph is generally a smooth, continuous curve that may have one or two turning points.
In this article, you will learn the definition of a cubic function, its general formula, how to find its intercepts, how to make a table of values, and how to draw its graph step by step. You will also study examples of graphing cubic functions, common mistakes, real-life applications, and practice questions.
These concepts can help students strengthen their algebra skills and prepare for more advanced mathematics.
What Is a Cubic Function?
A cubic function is a polynomial function of degree 3. Its general form is:
where:
- (a), (b), (c), and (d) are constants.
- (a is not 0).
- (x) is the independent variable.
- (f(x)) is the output of the function.
The coefficient (a) must not be zero because otherwise the function would have a degree lower than 3.
What Does the Graph of a Cubic Function Look Like?
The graph of a cubic function is a continuous curve. Its exact shape depends on the coefficients in the function.
For the simplest cubic function,
the curve passes through the origin ((0,0)). It rises from the lower-left side of the coordinate plane to the upper-right side.
Main Characteristics of a Cubic Graph
- The graph is continuous, with no breaks or gaps.
- A cubic function has at least one real root.
- It can have one, two, or three distinct real roots.
- It can have zero, one, or two turning points.
- Its graph extends indefinitely in both directions.
- If the leading coefficient is positive, the left end goes downward and the right end goes upward.
- If the leading coefficient is negative, the left end goes upward and the right end goes downward.
A cubic graph does not always look like the basic S-shaped curve. Some cubic functions have local maximum and minimum points, while others increase or decrease throughout their domain.
Important Terms Used in Graphing Cubic Functions
1. x-Intercept
The x-intercept is the point where the graph crosses or touches the x-axis.
At every x-intercept,
Therefore, to find the x-intercepts, solve:
2. y-Intercept
The y-intercept is the point where the graph crosses the y-axis.
At the y-intercept,
For the general cubic function,
we get:
Thus, the y-intercept is ((0,d)).
3. Root or Zero
A root is a value of (x) that makes the function equal to zero.
For example, if
then:
Therefore, (x=2) is a real root, and the graph crosses the x-axis at ((2,0)).
4. Turning Point
A turning point is a point where the graph changes direction from increasing to decreasing or from decreasing to increasing.
A cubic function can have at most two turning points.
5. Domain and Range
The domain is the set of possible input values. For every cubic polynomial, the domain is all real numbers.
The range is also all real numbers.
This is because a cubic polynomial is continuous and its two ends extend in opposite vertical directions.
Formulas Used in the Graph of Cubic Functions
The following formulas and rules are useful when graphing cubic functions.
| Purpose | Formula or rule |
|---|---|
| General cubic function | |
| x-intercepts | Solve (f(x)=0) |
| y-intercept | Calculate (f(0)) |
| Function value | Substitute the given value of (x) into (f(x)) |
| Maximum number of real roots | 3 |
| Maximum number of turning points | 2 |
| Domain | All real numbers |
| Range | All real numbers |
How to Draw the Graph of a Cubic Function
Follow these steps to draw the graph of a cubic function accurately.
Step 1: Write the Function
For example:
Step 2: Find the x-Intercepts
Put (y=0):
Take (x) common:
Therefore, x = 0, square root of 3 or – square root of 3.
The x-intercepts are:
(0, 0), (x,square root of 3), (x,square root of -3)
Step 3: Find the y-Intercept
Put (x=0):
The y-intercept is ((0,0)).
Step 4: Make a Table of Values
Choose several values of (x) and calculate (y).
For (y=x^3-3x):
| (x) | (y=x^3-3x) | Point |
|---|---|---|
| -2 | -2 | ((-2,-2)) |
| -1 | 2 | ((-1,2)) |
| 0 | 0 | ((0,0)) |
| 1 | -2 | ((1,-2)) |
| 2 | 2 | ((2,2)) |
Step 5: Plot the Points
Draw the horizontal x-axis and vertical y-axis. Mark the points from the table using a suitable scale.
Step 6: Join the Points with a Smooth Curve
Connect the plotted points with a smooth curve that follows the behaviour of the function. Do not join them using separate straight-line segments.
For this example, the graph rises to a local maximum, falls through the origin to a local minimum, and then rises again.
Examples of Graphing Cubic Functions
Example 1: Draw the Graph of (y=x^3)
Solution
The function is:
Make a table of values.
| (x) | (y=x^3) | Point |
|---|---|---|
| -2 | -8 | ((-2,-8)) |
| -1 | -1 | ((-1,-1)) |
| 0 | 0 | ((0,0)) |
| 1 | 1 | ((1,1)) |
| 2 | 8 | ((2,8)) |
Steps to draw the graph:
- Draw the coordinate axes.
- Plot the five points.
- Join them with a smooth curve.
- Make sure the curve passes through the origin.
Answer: The graph of (y=x^3) is an increasing cubic curve. It extends from the lower-left to the upper-right of the coordinate plane.
Example 2: Draw the Graph of (y=x^3-8)
Solution
The function is:
First, find the x-intercept by putting (y=0).
Therefore, the x-intercept is ((2,0)).
Now find the y-intercept by putting (x=0).
Therefore, the y-intercept is ((0,-8)).
Make a table of values.
| (x) | (y=x^3-8) | Point |
|---|---|---|
| 0 | -8 | ((0,-8)) |
| 1 | -7 | ((1,-7)) |
| 2 | 0 | ((2,0)) |
| 3 | 19 | ((3,19)) |
Plot these points and join them with a smooth curve.
Answer: The graph has the same general shape as (y=x^3), but it is shifted 8 units downward.
Example 3: Draw the Graph of (y=x^3-3x)
Solution
Given:
Factor the expression:
To find the x-intercepts, put (y=0).
Hence,
The x-intercepts are:
The y-intercept is also ((0,0)).
Use the table of values below.
| (x) | (y=x^3-3x) |
|---|---|
| -2 | -2 |
| -1 | 2 |
| 0 | 0 |
| 1 | -2 |
| 2 | 2 |
Plot the points and draw a smooth curve.
Answer: The graph crosses the x-axis at three distinct points. It has one local maximum and one local minimum.
Example 4: Draw the Graph of (y=-x^3)
Solution
Given:
Make a table of values.
| (x) | (y=-x^3) | Point |
|---|---|---|
| -2 | 8 | ((-2,8)) |
| -1 | 1 | ((-1,1)) |
| 0 | 0 | ((0,0)) |
| 1 | -1 | ((1,-1)) |
| 2 | -8 | ((2,-8)) |
Plot these points and join them with a smooth curve.
Answer: The graph decreases from the upper-left to the lower-right. It is the reflection of (y=x^3) across the x-axis.
Example 5: Find the Intercepts of (y=(x-1)(x+1)(x-2))
Solution
The function is:
To find the x-intercepts, put (y=0).
Therefore, x = 1, -1, 2
The x-intercepts are: (1, 0), (-1, 0), (2, 0)
To find the y-intercept, put (x=0).
The y-intercept is ((0,2)).
Answer: The graph crosses the x-axis at ((-1,0)), ((1,0)), and ((2,0)), and crosses the y-axis at ((0,2)).
Transformations of Cubic Graphs
Understanding transformations helps you sketch cubic graphs without calculating many points.
1. Vertical Shift
For:
the graph of (y=x^3) moves vertically.
- If (k>0), it moves upward.
- If (k<0), it moves downward.
Example: (y=x^3+4) moves 4 units upward.
2. Horizontal Shift
For:
the graph moves (h) units to the right when (h>0), and to the left when (h<0).
Example: (y=(x-2)^3) moves 2 units to the right.
3. Reflection Across the x-Axis
For:
the graph of (y=x^3) is reflected across the x-axis.
4. Vertical Stretch or Compression
For:
the value of (|a|) affects the steepness of the graph.
- If (|a|>1), the graph is steeper than (y=x^3).
- If (0<|a|<1), the graph is flatter.
- If (a<0), the graph also has a reflection across the x-axis.
Difference Between Linear, Quadratic, and Cubic Graphs
| Feature | Linear function | Quadratic function | Cubic function |
|---|---|---|---|
| Highest power | 1 | 2 | 3 |
| General form | (y=mx+c) | (y=ax^2+bx+c) | (y=ax^3+bx^2+cx+d) |
| Typical shape | Straight line | Parabola | Cubic curve |
| Maximum distinct real roots | 1, unless the function is identically zero | 2 | 3 |
| Maximum turning points | 0 | 1 | 2 |
| Domain of a polynomial | All real numbers | All real numbers | All real numbers |
Real-Life Applications of Cubic Functions
Cubic functions appear in several areas of mathematics, science, and engineering.
1. Volume Calculations
The volume of a cube with side length (x) is:
This is a direct example of a cubic relationship between side length and volume.
2. Engineering and Design
Cubic equations can arise when modelling certain design constraints, curves, and engineering relationships.
3. Physics
Some mathematical models in physics use cubic functions to describe relationships between quantities. Whether a cubic model is appropriate depends on the situation and the assumptions involved.
4. Computer Graphics
Cubic polynomial curves, including cubic Bézier curves, are used to create smooth curves in digital illustrations, animation, and design software.
Common Mistakes When Graphing Cubic Functions
Students should avoid the following errors:
- Forgetting the negative sign: For example, ((-2)^3=-8), not (8).
- Confusing the intercepts: The x-intercept is found by setting (y=0), while the y-intercept is found by setting (x=0).
- Using too few points: A small table may not show the curve’s behaviour clearly.
- Joining points with straight lines: A cubic graph should be drawn as a smooth curve.
- Assuming every cubic has three distinct roots: A cubic polynomial has at least one real root, but it may have only one or two distinct real roots.
- Assuming every cubic has two turning points: A cubic can have no turning points, one stationary turning point pattern depending on terminology, or two turning points. More precisely, it can have zero or two turning points; it may also have a stationary point of inflection.
- Ignoring the leading coefficient: The sign of the coefficient of (x^3) determines the graph’s end behaviour.
How Nisar Math Academy Can Help
Students who want to strengthen their algebra skills can explore the learning resources available at Nisar Math Academy. The website provides mathematics notes, recorded video lectures, assessments, lesson plans, worksheets, and solved questions.
Students can begin with available free resources, including selected Class 9 Maths Notes, lesson plans, assessments, and free lectures covering a question from each exercise. Additional course materials are available through membership.
These resources can support students who need a structured maths guide for Class 9 and learners who prefer studying through notes and recorded explanations.
Conclusion
The graph of cubic functions represents polynomial functions of degree 3. To draw a cubic graph, identify the function, find its intercepts, calculate selected values, plot the points, and connect them with a smooth curve.
Remember that a cubic polynomial has at least one real root, at most three distinct real roots, and at most two turning points. With regular practice, students can become more confident in sketching cubic graphs and interpreting their important features.
3. Short Notes: Graph of Cubic Functions
Definition
Definition
A cubic function is a polynomial function whose highest power of the variable is 3.
Important Facts
- The graph is a smooth, continuous curve.
- The domain and range are both all real numbers.
- A cubic polynomial has at least one real root.
- It has at most three distinct real roots.
- It has at most two turning points.
- A positive leading coefficient means the left end goes down and the right end goes up.
- A negative leading coefficient means the left end goes up and the right end goes down.
Important Formulas
- x-intercept: Put (y=0) and solve (f(x)=0).
- y-intercept: Put (x=0).
- Function value: Substitute the given value of (x).
- Volume of a cube: (V=x^3).
Steps for Graphing
- Write the function.
- Find the x-intercepts.
- Find the y-intercept.
- Prepare a table of values.
- Plot the points.
- Draw a smooth curve through the points.
Transformations
- (y=x^3+k): vertical shift.
- (y=(x-h)^3): horizontal shift.
- (y=-x^3): reflection across the x-axis.
- (y=ax^3): vertical stretch or compression, with reflection if (a<0).
Difference Between Roots and Turning Points
- Roots are the x-values for which (f(x)=0).
- Turning points are local maxima or minima where the graph changes direction.
A cubic graph can have three distinct roots but does not necessarily have three turning points.
4. Multiple-Choice Questions (MCQs)
Choose the correct option for each question. The answer key follows the questions.
Question 1
Question 1
What is a cubic function?
A. A function of degree 1
B. A function of degree 2
C. A function of degree 3
D. A function of degree 4
Question 2
Which of the following is a cubic function?
A. (y=2x+3)
B. (y=x^2+4)
C. (y=x^3-2x+1)
D. (y=5x^4+1)
Question 3
What is the general form of a cubic function?
A. (y=ax+b)
B. (y=ax^2+bx+c)
C. (y=ax^3+bx^2+cx+d,\ a\neq0)
D. (y=a/x)
Question 4
What is the y-intercept of (y=x^3+5)?
A. ((5,0))
B. ((0,5))
C. ((0,-5))
D. ((1,5))
Question 5
What is the value of (y=x^3) when (x=-2)?
A. 8
B. -4
C. -8
D. 4
Question 6
Which equation represents a cubic graph reflected across the x-axis from (y=x^3)?
A. (y=x^3+1)
B. (y=-x^3)
C. (y=(x-1)^3)
D. (y=x^3)
Question 7
What is the real root of (y=x^3-27)?
A. 2
B. 3
C. 9
D. -3
Question 8
How many distinct real roots can a cubic polynomial have at most?
A. 1
B. 2
C. 3
D. 4
Question 9
What is the maximum number of turning points of a cubic function?
A. 0
B. 1
C. 2
D. 3
Question 10
Find the x-intercepts of (y=x(x-2)(x+1)).
A. (-1,0,2)
B. (1,0,-2)
C. (0,1,2)
D. (-1,2,3)
Question 11
What is the y-intercept of (y=2x^3-3x+4)?
A. ((4,0))
B. ((0,4))
C. ((0,-3))
D. ((2,0))
Question 12
What is the domain of a cubic polynomial function?
A. Only positive real numbers
B. Only integers
C. All real numbers
D. Only non-zero real numbers
Question 13
Which is the correct end behaviour of (y=-x^3)?
A. Both ends go upward
B. Both ends go downward
C. Left end goes up and right end goes down
D. Left end goes down and right end goes up
Question 14
What is the value of (y=x^3-3x) when (x=2)?
A. 2
B. -2
C. 8
D. 14
Question 15
Which formula gives the volume of a cube with side length (x)?
A. (V=3x)
B. (V=x^2)
C. (V=x^3)
D. (V=2x^3)
MCQ Answer Key
| Question | Correct answer |
|---|---|
| 1 | C |
| 2 | C |
| 3 | C |
| 4 | B |
| 5 | C |
| 6 | B |
| 7 | B |
| 8 | C |
| 9 | C |
| 10 | A |
| 11 | B |
| 12 | C |
| 13 | C |
| 14 | A |
| 15 | C |
5. Worksheet / Assignment
Worksheet: Graph of Cubic Functions
Worksheet: Graph of Cubic Functions
Subject: Mathematics
Topic: Graph of Cubic Functions
Instructions: Answer all questions. Show your working for numerical problems and use graph paper where required.
Section A: Definitions and Concepts
Question 1. Define a cubic function and write its general form.
Question 2. What is the difference between an x-intercept and a y-intercept?
Question 3. How many distinct real roots can a cubic polynomial have at most?
Question 4. State the domain and range of a cubic polynomial function.
Section B: Calculations
Question 5. Find the value of (y=x^3-2x+1) when (x=2).
Question 6. Find the y-intercept of:
Question 7. Find the real root of:
Question 8. Find all x-intercepts of:
Question 9. Find the x-intercept and y-intercept of:
Section C: Graphing Problems
Question 10. Complete the following table for (y=x^3), and draw its graph.
| (x) | (y=x^3) |
|---|---|
| -2 | _____ |
| -1 | _____ |
| 0 | _____ |
| 1 | _____ |
| 2 | _____ |
Question 11. Make a table of values for (y=x^3-3x) using (x=-2,-1,0,1,2). Plot the points and sketch the curve.
Question 12. Sketch the graph of (y=-x^3) using at least five points. Describe its direction from left to right.
Section D: Applications and Reasoning
Question 13. A cube has a side length of 4 cm. Calculate its volume using the formula (V=x^3).
Question 14. Explain how the graph of (y=x^3+5) differs from the graph of (y=x^3).
Question 15. A student says that every cubic function has exactly three distinct real roots and two turning points. Is this statement correct? Explain your answer.
Answer Key
Section A
Answer 1. A cubic function is a polynomial function of degree 3.
Answer 2. An x-intercept is found by setting (y=0). A y-intercept is found by setting (x=0).
Answer 3. Three distinct real roots.
Answer 4. Both domain and range are all real numbers, (\mathbb R).
Section B
Answer 5.
Answer 6.
Put (x=0):
The y-intercept is (\boxed{(0,-7)}).
Answer 7.
Answer 8.
Thus, (x=0,3,-2).
The x-intercepts are (\boxed{(0,0),(3,0),(-2,0)}).
Answer 9.
For the x-intercept:
For the y-intercept, put (x=0):
Therefore, the intercepts are (\boxed{(2,0)}) and (\boxed{(0,-8)}).
Section C
Answer 10.
| (x) | (y=x^3) |
|---|---|
| -2 | -8 |
| -1 | -1 |
| 0 | 0 |
| 1 | 1 |
| 2 | 8 |
Plot the five points and connect them with a smooth increasing curve.
Answer 11.
| (x) | (y=x^3-3x) |
|---|---|
| -2 | -2 |
| -1 | 2 |
| 0 | 0 |
| 1 | -2 |
| 2 | 2 |
Plot the points and draw a smooth curve through them.
Answer 12.
| (x) | (y=-x^3) |
|---|---|
| -2 | 8 |
| -1 | 1 |
| 0 | 0 |
| 1 | -1 |
| 2 | -8 |
The graph decreases from the upper-left to the lower-right.
Section D
Answer 13.
Answer 14. The graph shifts 5 units upward. Its y-intercept changes from ((0,0)) to ((0,5)).
Answer 15. The statement is incorrect. A cubic polynomial has at least one real root and at most three distinct real roots. It can have zero or two turning points; it does not always have exactly two.
6. Frequently Asked Questions (FAQs)
1. What is the graph of a cubic function?
1. What is the graph of a cubic function?
It is the graph of a polynomial function of degree 3. It is a continuous curve whose shape depends on the coefficients.
2. What is the general formula for a cubic function?
The general formula is:
3. How do you find the x-intercepts of a cubic graph?
Set (f(x)=0) and solve the resulting cubic equation. Each real solution gives an x-intercept.
4. How do you find the y-intercept of a cubic function?
Substitute (x=0). For the general cubic function, the y-intercept is ((0,d)).
5. Can a cubic function have three real roots?
Yes. It can have three distinct real roots, one distinct real root, or two distinct real roots when one root is repeated.
6. How many turning points can a cubic graph have?
It can have zero or two turning points. A cubic may also have a stationary point of inflection, where the tangent is horizontal but the graph does not change direction.
7. What is the difference between (y=x^3) and (y=-x^3)?
The graph of (y=x^3) increases from the lower-left to the upper-right. The graph of (y=-x^3) decreases from the upper-left to the lower-right.
8. Where can students find Class 9 Maths notes and video lectures?
Students can explore Nisar Math Academy at https://www.nisarmathacademy.com/ for available mathematics notes, recorded lectures, assessments, lesson plans, and other learning resources.
You May be Interested In:
Graph of Quadratic Functions: Definition, Formula, Examples and Graphs
What Do You Know About Graph of Linear Functions? Definition, Examples, Formulas and Graphs
Functions and Their Graphs: Definition, Types, Examples and Basic Graphs

Leave a Reply