What Do You Know About Graph of Linear Functions? Definition, Examples, Formulas and Graphs
Introduction
The graph of linear functions is an important topic in mathematics because it helps us represent a mathematical relationship visually. Instead of looking only at an equation, we can use a graph to see how the value of one variable changes when another variable changes.
A linear function produces a straight-line graph when it is plotted on the coordinate plane.
For Class 9 students, understanding linear functions is especially useful because graphs are connected with equations, coordinates, slope, tables of values, and real-life problems.
In this article, you will learn:
- What a linear function is
- What the graph of a linear function looks like
- How to plot a linear function
- How to make a table of values
- How to find the slope and intercept
- How to solve an example of a linear function with solution and graph
- Common mistakes students make
- Practical applications of linear functions
What Is a Linear Function?
A linear function is a function whose graph is a straight line.
A common form of a linear function is:
where:
- is the independent variable.
- is the dependent variable.
- is the slope or gradient.
- is the y-intercept.
For example:
is a linear function.
The coefficient of , which is 2, represents the slope, while 1 represents the y-intercept.
What Is the Graph of a Linear Function?
The graph of a linear function is the collection of all ordered pairs that satisfy the function.
For example, consider:
Choose some values of and calculate the corresponding values of .
| Ordered Pair | ||
|---|---|---|
| -2 | -3 | (-2, -3) |
| -1 | -1 | (-1, -1) |
| 0 | 1 | (0, 1) |
| 1 | 3 | (1, 3) |
| 2 | 5 | (2, 5) |
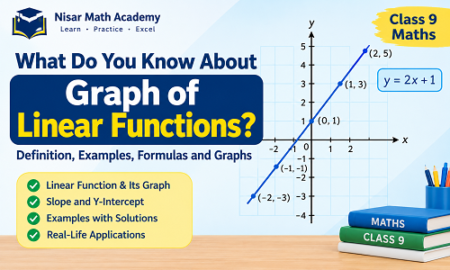
Plot these points on the coordinate plane. When the points are joined, they form a straight line.
Diagram-Based Explanation
Imagine a coordinate plane containing a horizontal x-axis and a vertical y-axis.
For the function
plot the points:
These points lie on the same straight line. The line crosses the y-axis at and rises from left to right.
This is the graph of the linear function.
Standard Form of a Linear Equation
A linear equation can also be written in standard form:
where , , and are constants.
For example:
is a linear equation.
It can be changed into slope-intercept form:
or
Therefore:
and
Important Parts of a Linear Graph
1. Slope
The slope tells us how steep a straight line is and whether it rises or falls.
The formula for slope is:
where and are two points on the line.
2. Y-Intercept
The y-intercept is the point where the graph crosses the y-axis.
In:
the value of is the y-coordinate of the y-intercept.
Thus, the y-intercept is:
For example:
has y-intercept:
3. X-Intercept
The x-intercept is the point where the graph crosses the x-axis.
At the x-axis:
Therefore, to find the x-intercept, put in the equation.
For example:
Put :
Therefore, the x-intercept is:
Types of Slopes
The slope of a linear function can be positive, negative, zero, or undefined.
Positive Slope
If:
the line rises from left to right.
Example:
Negative Slope
If:
the line falls from left to right.
Example:
Zero Slope
A horizontal line has slope zero.
Example:
The value of remains constant.
Undefined Slope
A vertical line has an undefined slope.
Example:
The value of remains constant.
How to Draw the Graph of a Linear Function
There are several methods for drawing the graph of a linear function.
Method 1: Table of Values
Consider:
Choose values of :
Calculate .
| Ordered Pair | ||
|---|---|---|
| -2 | 0 | (-2, 0) |
| -1 | 1 | (-1, 1) |
| 0 | 2 | (0, 2) |
| 1 | 3 | (1, 3) |
| 2 | 4 | (2, 4) |
Now plot these points and join them with a straight line.
Method 2: Using the Y-Intercept and Slope
Consider:
Here:
and:
The y-intercept is:
The slope 2 can be written as:
This means that for every 1 unit we move to the right, we move 2 units upward.
Starting from , another point is:
Join the points with a straight line.
Worked Example 1: Graph of
Question
Draw the graph of:
Solution
Make a table of values.
| Calculation | ||
|---|---|---|
| -2 | -3 | |
| -1 | -1 | |
| 0 | 1 | |
| 1 | 3 | |
| 2 | 5 |
Therefore, the points are:
Plot these points on the coordinate plane and join them.
The resulting graph is a straight line.
Important Information
- Slope =
- Y-intercept =
- Y-intercept point =
- The line rises from left to right.
Worked Example 2: Graph of
Question
Draw the graph of:
Solution
Choose values of .
| Ordered Pair | ||
|---|---|---|
| 0 | 4 | (0, 4) |
| 1 | 3 | (1, 3) |
| 2 | 2 | (2, 2) |
| 3 | 1 | (3, 1) |
| 4 | 0 | (4, 0) |
Plot these points and join them.
The graph is a straight line that falls from left to right.
Here:
and:
Therefore, the y-intercept is:
and the x-intercept is:
Worked Example 3: Finding the Equation from Two Points
Question
Find the equation of the line passing through:
and:
Step 1: Find the slope
Use:
Therefore:
Step 2: Use
We have:
Use the point :
Therefore, the equation is:
Worked Example 4: Finding the X- and Y-Intercepts
Question
Find the x-intercept and y-intercept of:
X-Intercept
Put:
Then:
Therefore:
Y-Intercept
Put:
Then:
Therefore:
The graph can be drawn by plotting and and joining these two points with a straight line.
Linear Functions and Real-Life Applications
Linear functions are not limited to textbook questions. They can represent many situations where one quantity changes at a constant rate.
1. Taxi Fare
Suppose a taxi charges a fixed amount of Rs. 100 plus Rs. 50 per kilometre.
The total fare for kilometres can be represented by:
Here:
- 50 is the rate per kilometre.
- 100 is the initial charge.
2. Mobile Data or Internet Usage
If a service has a fixed monthly charge and an additional constant charge based on usage, a linear model may be used.
3. Saving Money
Suppose a student already has Rs. 500 and saves Rs. 200 every week.
After weeks:
This is a linear function.
4. Distance and Time
If a person travels at a constant speed, distance can be represented as a linear function of time.
For example, at a constant speed of 5 km per hour:
where is distance and is time.
Difference Between a Linear Equation and Its Graph
| Linear Equation | Graph |
|---|---|
| Represents a mathematical relationship | Represents the relationship visually |
| Written using variables and constants | Drawn on a coordinate plane |
| Example: | A straight line |
| Can be solved algebraically | Can be analyzed visually |
Common Questions About Graphs of Linear Functions
What is the graph of a linear function?
The graph of a linear function is a straight line on the coordinate plane.
Why is the graph of a linear function a straight line?
A linear function has a constant rate of change. Therefore, equal changes in produce equal changes in , resulting in a straight line.
What does the slope tell us?
The slope tells us the rate at which changes with respect to . It also tells us the direction and steepness of the line.
How do you find the y-intercept?
In:
the y-intercept is , and the point is:
How do you find the x-intercept?
Put:
in the equation and solve for .
How many points are needed to draw a straight line?
Two distinct points are sufficient to determine and draw a straight line. However, using three or more points can help verify that the calculations are correct.
Common Mistakes Students Make
1. Mixing Up X and Y Coordinates
Remember that an ordered pair is written as:
The x-coordinate comes first.
2. Using the Wrong Slope Formula
The correct formula is:
Keep the order consistent in both the numerator and denominator.
3. Forgetting the Negative Sign
For:
the slope is:
not 3.
4. Plotting Points Incorrectly
Always move along the x-axis first and then along the y-axis when plotting an ordered pair.
5. Not Joining Points Properly
The graph of a linear function should be a straight line. Do not join the points using a curved line.
6. Confusing X-Intercept and Y-Intercept
- At the x-intercept, .
- At the y-intercept, .
Tips for Class 9 Students
When solving graph questions:
- Write the given equation clearly.
- Identify whether it is a linear equation or function.
- Make a table of values if required.
- Calculate each value carefully.
- Write the ordered pairs.
- Draw the x-axis and y-axis.
- Choose an appropriate scale.
- Plot the points accurately.
- Join the points with a straight line.
- Check whether the graph agrees with the equation.
Students looking for a maths guide for Class 9, Class 9 maths notes, worksheets, assessments, and video explanations can also explore the learning resources available through Nisar Math Academy.
Short Conclusion
The graph of linear functions provides a simple visual way to understand the relationship between two variables. A linear function produces a straight-line graph, and its equation can usually be written in the form:
The slope describes the rate of change, while gives the y-intercept. Students can draw a linear graph by creating a table of values, plotting ordered pairs, or using the slope and y-intercept.
Regular practice with equations, tables, coordinates, and graphs can make this topic much easier for Class 9 mathematics students.
Short Notes: Graph of Linear Functions
Definition
A linear function is a function whose graph is a straight line.
Main Formula
where:
- = slope
- = y-intercept
Slope Formula
Y-Intercept
For:
the y-intercept is:
X-Intercept
Put:
and solve for .
Types of Slope
- Positive slope → line rises from left to right.
- Negative slope → line falls from left to right.
- Zero slope → horizontal line.
- Undefined slope → vertical line.
Important Points
- A linear function has a straight-line graph.
- Two distinct points are enough to draw a straight line.
- Ordered pairs are written as .
- At the x-intercept, .
- At the y-intercept, .
MCQs: Graph of Linear Functions
1. What is the graph of a linear function?
A. Circle
B. Straight line
C. Parabola
D. Triangle
Correct Answer: B. Straight line
2. Which is the slope-intercept form of a linear function?
A.
B.
C.
D.
Correct Answer: A. y=mx+cy=mx+c
3. What is the slope of ?
A. 5
B. -3
C. 3
D. 8
Correct Answer: C. 3
4. What is the y-intercept of ?
A. 2
B. 7
C. -7
D. -2
Correct Answer: B. 7
5. What is the y-intercept point of ?
A.
B.
C.
D.
Correct Answer: C. (0,−3)(0,-3)
6. What is the slope of ?
A. 4
B. 2
C. -2
D. -4
Correct Answer: C. -2
7. Which line rises from left to right?
A. A line with positive slope
B. A line with negative slope
C. A vertical line
D. A line with undefined slope
Correct Answer: A. A line with positive slope
8. At the x-intercept, what is the value of ?
A. 1
B. -1
C. 0
D.
Correct Answer: C. 0
9. Find the slope between and .
A. 1
B. 2
C. 3
D. 4
Correct Answer: B. 2
10. Which equation represents a horizontal line?
A.
B.
C.
D.
Correct Answer: A. y=5y=5
11. Which equation represents a vertical line?
A.
B.
C.
D.
Correct Answer: B. x=2x=2
12. What is the slope of the line joining and ?
A. 1
B. 2
C. 3
D. 4
Correct Answer: B. 2
13. For , what is when ?
A. 3
B. 4
C. 5
D. 6
Correct Answer: C. 5
14. Which point lies on ?
A.
B.
C.
D.
Correct Answer: B. (1,3)(1,3)
15. A line with a negative slope:
A. Rises from left to right
B. Falls from left to right
C. Is always horizontal
D. Is always vertical
Correct Answer: B. Falls from left to right
Worksheet / Assignment
Part A: Definitions and Concepts
- Define a linear function.
- What type of graph does a linear function produce?
- What is meant by the slope of a line?
- Write the slope-intercept form of a linear function.
- What is the difference between an x-intercept and a y-intercept?
Part B: Short Questions
- Identify the slope and y-intercept of:
- Identify the slope and y-intercept of:
- State whether the line rises or falls from left to right:
- Find the slope between the points:
- Find the y-intercept of:
Part C: Numerical Problems
- Make a table of values for:
using .
- Find the x-intercept and y-intercept of:
- Find the equation of the line with slope 3 passing through .
- Find the equation of the line passing through:
and:
- A student has Rs. 300 and saves Rs. 100 every week. Write a linear function for the total amount after weeks.
Answer Key
- A function whose graph is a straight line.
- A straight line.
- The rate of change of with respect to .
- The x-intercept occurs where , while the y-intercept occurs where .
- The line falls from left to right.
- Y-intercept , so the point is .
| -2 | 1 |
| -1 | 2 |
| 0 | 3 |
| 1 | 4 |
| 2 | 5 |
For x-intercept:
So x-intercept = .
For y-intercept:
So y-intercept = .
First find the slope:
Using :
Therefore:
Frequently Asked Questions
1. What is the graph of a linear function?
The graph of a linear function is a straight line on the coordinate plane.
2. What is the general form of a linear function?
A common form is:
where is the slope and is the y-intercept.
3. How do I draw the graph of a linear function?
You can make a table of values, calculate ordered pairs, plot the points on the coordinate plane, and join them with a straight line.
4. How do I find the slope of a line?
Use:
for two points on the line.
5. What does a positive slope mean?
A positive slope means that the line rises from left to right.
6. What does a negative slope mean?
A negative slope means that the line falls from left to right.
7. How do I find the y-intercept?
In:
the y-intercept is , giving the point .
8. Why are graphs of linear functions important in Class 9 maths?
They help students understand equations, coordinates, slope, rate of change, and relationships between variables. They also provide a foundation for more advanced mathematics.
You May be Interested In:
Functions and Their Graphs: Definition, Types, Examples and Basic Graphs
Applications of Polygons: Uses of Polygons in Our Life with Examples
Ex 12.1 Class 9th – Complete Solution | Class 9 Maths Notes Chapter 12

Leave a Reply