Ungrouped and Grouped Data: Definitions, Differences and Examples
Introduction
Data is an important part of mathematics and statistics. We collect data to obtain information, identify patterns, compare values, and solve different mathematical problems. However, a large collection of numbers can sometimes be difficult to understand. To make data easier to read and analyse, we organize it into different forms.
In statistics, data is commonly presented in two ways: ungrouped data and grouped data.
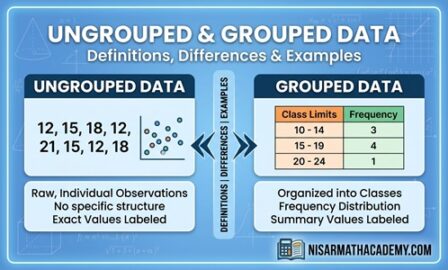
Ungrouped data consists of individual observations presented separately, while grouped data organizes observations into different groups or class intervals along with their frequencies.
In this article, you will learn the definitions of ungrouped and grouped data, their differences, frequency distribution tables, mathematical examples, formulas, and real-life applications. These concepts will help Class 9 students understand basic statistics more effectively.
What Is Data in Statistics?
Data refers to a collection of facts, figures, numbers, or observations gathered for a particular purpose.
For example, the marks obtained by five students in a mathematics test are:
45, 60, 75, 80, 90
These numbers represent data because they provide information about the students’ performance.
Data can be collected from different sources, such as:
- Students’ examination marks.
- Heights and weights of individuals.
- Temperatures recorded during a week.
- Population of different cities.
- Monthly sales of a shop.
- Number of books read by students.
In statistics, data can be organized as grouped or ungrouped data.
What Is Ungrouped Data?
Definition: Ungrouped data is a collection of individual observations presented in their original or separate form without arranging them into class intervals or frequency groups.
In simple words, when data values are written separately rather than organized into groups, they are called ungrouped data.
Example of Ungrouped Data
Suppose the marks obtained by 10 students in a mathematics test are:
35, 40, 45, 50, 55, 60, 65, 70, 75, 80
This is an example of ungrouped data because every student’s marks are written separately.
Each number represents an individual observation.
Characteristics of Ungrouped Data
The main characteristics of ungrouped data are:
- Individual observations are presented separately.
- Data values can be easily identified.
- It is suitable for small data collections.
- No class intervals are required.
- It provides detailed information about every observation.
- Large collections of ungrouped data may be difficult to understand.
Example: Arranging Ungrouped Data
Consider the following data representing the number of books read by eight students:
3, 5, 2, 4, 3, 6, 5, 3
The observations can also be arranged in ascending order:
2, 3, 3, 3, 4, 5, 5, 6
Both lists represent ungrouped data because the observations are still presented individually.
What Is Grouped Data?
Definition: Grouped data is a collection of observations organized into groups or class intervals, with the frequency of each group shown separately.
In simple words, when a large collection of data is divided into different groups to make it easier to understand and analyse, it is called grouped data.
Example of Grouped Data
Suppose the marks obtained by 20 students in a mathematics test are organized into the following table:
| Marks (Class Interval) | Number of Students (Frequency) |
|---|---|
| 0–10 | 2 |
| 10–20 | 4 |
| 20–30 | 6 |
| 30–40 | 5 |
| 40–50 | 3 |
| Total | 20 |
This table represents grouped data because the marks are divided into class intervals, and the number of students in each interval is recorded.
Characteristics of Grouped Data
The main characteristics of grouped data are:
- Observations are organized into groups or class intervals.
- Each group has a corresponding frequency.
- It makes large data collections easier to understand.
- It provides a summarized form of information.
- It is useful for preparing frequency distribution tables.
- Individual observations may not be identifiable from the grouped table.
Important Terms Used in Grouped Data
Before learning how to prepare a grouped frequency distribution table, it is important to understand some basic statistical terms.
1. Frequency
Frequency is the number of times a particular value or group of values occurs in a data collection.
For example, consider:
2, 3, 3, 4, 5, 3, 6
The number 3 appears three times. Therefore, its frequency is 3.
2. Class Interval
A class interval is a range of values used to divide data into different groups.
For example:
10–20, 20–30, 30–40, 40–50
Each range represents a class interval.
3. Lower Class Limit
The smallest value included in a class interval is called its lower class limit.
For example, in the class interval 20–30, the lower class limit is 20.
4. Upper Class Limit
The largest value included in a class interval is called its upper class limit.
For example, in the class interval 20–30, the upper class limit is 30.
5. Class Width
Class width is the difference between the upper and lower class boundaries.
For equal-width continuous intervals, it can be calculated using:
\[ \text{Class Width}=\text{Upper Boundary}-\text{Lower Boundary} \]
For example, for the class interval 20–30:
\[ 30-20=10 \]
Therefore, the class width is 10.
6. Class Mark (Midpoint)
The class mark is the midpoint of a class interval.
It is calculated using:
\[ \text{Class Mark}= \frac{\text{Lower Limit}+\text{Upper Limit}}{2} \]
For example, for the class interval 20–30:
\[ =\frac{20+30}{2} \]
\[ =\frac{50}{2}=25 \]
Therefore, the class mark is 25.
Difference Between Grouped Data and Ungrouped Data
The main difference between grouped data and ungrouped data is the way observations are presented.
Ungrouped data displays individual values, whereas grouped data organizes observations into class intervals or categories.
Comparison Table
| Ungrouped Data | Grouped Data |
|---|---|
| Individual observations are presented separately. | Observations are organized into groups. |
| No class intervals are required. | Class intervals are generally used for numerical data. |
| Suitable for small data collections. | Suitable for large data collections. |
| Individual values are easily identified. | Individual values may not be identifiable. |
| Provides detailed information. | Provides summarized information. |
| Usually requires less preparation. | Requires classification and frequency counting. |
| Analysis may become difficult for large datasets. | Large datasets become easier to analyse. |
Example Showing the Difference
Suppose the marks of 10 students are:
Ungrouped Data:
12, 15, 18, 20, 22, 25, 27, 30, 32, 35
The same data can be organized into groups:
Grouped Data:
| Marks | Frequency |
|---|---|
| 10–20 | 3 |
| 20–30 | 4 |
| 30–40 | 3 |
| Total | 10 |
The first representation shows every observation separately, while the second representation summarizes the observations into groups.Note: The class intervals above use the exclusive convention, so a boundary value such as 20 belongs to the next interval.
How to Convert Ungrouped Data into Grouped Data
Converting ungrouped data into grouped data means arranging individual observations into suitable class intervals and calculating their frequencies.
Follow these steps:
- Collect all the observations.
- Arrange the data in ascending order.
- Find the minimum and maximum values.
- Calculate the range.
- Select suitable class intervals.
- Count the observations in each interval.
- Prepare a frequency distribution table.
Formula for Range
\[ \text{Range}=\text{Maximum Value}-\text{Minimum Value} \]
Worked Example 1: Preparing a Grouped Frequency Distribution Table
The following marks were obtained by 15 students in a mathematics test:
12, 15, 18, 22, 24, 25, 28, 30, 32, 35, 36, 38, 42, 45, 48
Prepare a grouped frequency distribution table using class intervals of width 10.
Step 1: Find the minimum value.
Minimum value = 12
Step 2: Find the maximum value.
Maximum value = 48
Step 3: Calculate the range.
\[ \text{Range}=48-12=36 \]
Step 4: Select class intervals.
Using class intervals of width 10:
10–20, 20–30, 30–40, 40–50
Step 5: Count the observations in each interval.
| Class Interval | Observations | Frequency |
|---|---|---|
| 10–20 | 12, 15, 18 | 3 |
| 20–30 | 22, 24, 25, 28 | 4 |
| 30–40 | 30, 32, 35, 36, 38 | 5 |
| 40–50 | 42, 45, 48 | 3 |
| Total | 15 |
Answer: The table above is the required grouped frequency distribution.
Notice that:
\[ \sum f=3+4+5+3=15 \]
The sum of all frequencies is equal to the total number of observations.
Formulas Used in Grouped and Ungrouped Data
The following formulas are useful when solving basic statistics problems.
1. Range
\[ R=X_{\max}-X_{\min} \]
Where:
- \(R\) = Range
- \(X_{\max}\) = Maximum value
- \(X_{\min}\) = Minimum value
2. Total Frequency
\[ N=\sum f \]
Where:
- \(N\) = Total number of observations
- \(f\) = Frequency of each class
3. Class Mark
\[ x=\frac{L+U}{2} \]
Where:
- \(L\) = Lower class limit
- \(U\) = Upper class limit
- \(x\) = Class mark
4. Mean of Ungrouped Data
The arithmetic mean of ungrouped data is calculated by dividing the sum of all observations by the total number of observations.
\[ \bar{x}=\frac{\sum x}{n} \]
Where:
- \(\bar{x}\) = Mean
- \(\sum x\) = Sum of all observations
- \(n\) = Number of observations
5. Mean of Grouped Data
For grouped data, the mean can be estimated using class marks and frequencies.
\[ \bar{x}=\frac{\sum fx}{\sum f} \]
Where:
- \(f\) = Frequency
- \(x\) = Class mark
- \(\sum fx\) = Sum of frequency multiplied by class mark
- \(\sum f\) = Total frequency
Solved Examples of Ungrouped and Grouped Data
Worked Example 2: Finding the Mean of Ungrouped Data
Find the mean of the following observations:
10, 20, 30, 40, 50
Solution:
Formula:
\[ \bar{x}=\frac{\sum x}{n} \]
Step 1: Find the sum of observations.
\[ \sum x=10+20+30+40+50 \]
\[ \sum x=150 \]
Step 2: Count the observations.
\[ n=5 \]
Step 3: Apply the formula.
\[ \bar{x}=\frac{150}{5} \]
\[ \boxed{\bar{x}=30} \]
Answer: The mean is 30.
Worked Example 3: Finding the Mean of Grouped Data
Calculate the mean of the following grouped frequency distribution.
| Class Interval | Frequency |
|---|---|
| 0–10 | 2 |
| 10–20 | 3 |
| 20–30 | 4 |
| 30–40 | 1 |
Solution:
We use the formula:
\[ \bar{x}=\frac{\sum fx}{\sum f} \]
Step 1: Find the class marks.
\[ x=\frac{L+U}{2} \]
For the first class:
\[ x=\frac{0+10}{2}=5 \]
Similarly, the class marks are 5, 15, 25, and 35.
Step 2: Calculate \(fx\).
| Class Interval | \(f\) | Class Mark \(x\) | \(fx\) |
|---|---|---|---|
| 0–10 | 2 | 5 | 10 |
| 10–20 | 3 | 15 | 45 |
| 20–30 | 4 | 25 | 100 |
| 30–40 | 1 | 35 | 35 |
| Total | 10 | 190 |
Step 3: Apply the formula.
\[ \bar{x}=\frac{\sum fx}{\sum f} \]
\[ \bar{x}=\frac{190}{10} \]
\[ \boxed{\bar{x}=19} \]
Answer: The estimated mean is 19.
Note that the mean calculated from grouped data is generally an estimate because individual observations are represented by class marks.
Worked Example 4: Finding the Range of Ungrouped Data
Find the range of the following data:
15, 25, 10, 40, 35, 20
Solution:
Formula:
\[ R=X_{\max}-X_{\min} \]
Maximum value = 40
Minimum value = 10
Therefore:
\[ R=40-10 \]
\[ \boxed{R=30} \]
Answer: The range is 30.
Diagram-Based Explanation of Grouped and Ungrouped Data
A simple diagram can help students understand the difference between these two forms of data.
Imagine two boxes:
Box A: Ungrouped Data
Inside the box, individual numbers are written separately:
5, 8, 10, 12, 15, 18, 20, 22
Box B: Grouped Data
The same numbers are organized into class intervals:
| Class Interval | Frequency |
|---|---|
| 0–10 | 2 |
| 10–20 | 4 |
| 20–30 | 2 |
The first box displays individual observations, while the second box shows how many observations belong to each group.
This is the basic idea behind ungrouped and grouped data.
Real-Life Applications of Grouped and Ungrouped Data
Both forms of data are used in everyday life, education, business, and scientific research.
1. Examination Results
Teachers may record the marks of individual students as ungrouped data. They can then organize the marks into intervals to see how many students scored within each range.
2. Population Studies
Researchers may record individual ages and then group them into age categories to understand the population structure.
3. Weather Reports
Daily temperatures can be recorded separately as ungrouped data. They may also be grouped into temperature ranges for statistical analysis.
4. Business and Sales
A shopkeeper may record individual daily sales and organize them into different sales ranges to understand business performance.
5. Health and Fitness Research
Researchers may collect individual measurements and organize them into suitable categories to summarize the collected information.
6. School Surveys
A school may collect information about the number of hours students spend studying. The observations can be grouped into intervals to identify general study patterns.
Common Mistakes Students Make
Students sometimes make mistakes while working with grouped and ungrouped data. The following points can help avoid these errors.
1. Confusing frequency with class interval: A class interval represents a range, while frequency represents the number of observations in that range.
2. Incorrectly counting observations: Every observation must be counted in the correct class interval.
3. Overlapping class intervals: Class intervals should be defined clearly so that an observation does not belong to two different classes.
4. Incorrectly calculating class marks: Always add the lower and upper limits and divide the result by 2.
5. Forgetting total frequency: The sum of all frequencies must equal the total number of observations.
6. Using the wrong mean formula: Use \(\sum x/n\) for ungrouped data and \(\sum fx/\sum f\) for the estimated mean of grouped data.
7. Confusing exact and estimated mean: The mean obtained from grouped data using class marks is generally an estimate, not necessarily the exact mean of the original observations.
Frequently Asked Questions
What is the difference between grouped data and ungrouped data?
Ungrouped data presents individual observations separately, while grouped data organizes observations into class intervals or categories with their frequencies.
What is an example of ungrouped data?
The numbers 10, 15, 20, 25, and 30 represent ungrouped data because each observation is presented separately.
What is an example of grouped data?
A frequency table containing class intervals such as 0–10, 10–20, and 20–30, along with their frequencies, is an example of grouped data.
Why is data grouped in statistics?
Data is grouped to make large collections of observations easier to read, summarize, compare, and analyse.
What is frequency in grouped data?
Frequency is the number of observations belonging to a particular class interval.
Can ungrouped data be converted into grouped data?
Yes. Ungrouped data can be converted into grouped data by selecting suitable class intervals and counting the observations in each interval.
Which type of data is more accurate?
Ungrouped data preserves individual observations. Grouped data provides a summary, but some individual information may be lost.
What is the formula for the mean of grouped data?
The formula is:
\[ \bar{x}=\frac{\sum fx}{\sum f} \]
Here, \(f\) represents frequency and \(x\) represents the class mark.
Conclusion
Ungrouped and grouped data are two important ways of presenting statistical information. Ungrouped data displays individual observations separately, whereas grouped data organizes observations into class intervals with their corresponding frequencies.
Ungrouped data is particularly useful for small collections, while grouped data makes large collections easier to understand and analyse. Students should understand the definitions, characteristics, differences, and formulas associated with both types of data.
For additional support, students can explore Nisar Math Academy for mathematics notes, recorded video lectures, assessments, worksheets, lesson plans, and solved questions. Free Class 9 Maths resources are also available to help students strengthen their mathematical concepts.
3. Short Notes: Ungrouped and Grouped Data
These short notes are useful for quick revision before a mathematics test or examination.
Important Definitions
Data: A collection of facts, figures, numbers, or observations.
Ungrouped Data: Data in which individual observations are presented separately without dividing them into class intervals.
Grouped Data: Data organized into different groups or class intervals along with their frequencies.
Frequency: The number of times a value or group of values occurs.
Class Interval: A range of values used to divide data into groups.
Class Mark: The midpoint of a class interval.
Important Formulas
| Quantity | Formula |
|---|---|
| Range | \(R=X_{\max}-X_{\min}\) |
| Total Frequency | \(N=\sum f\) |
| Class Mark | \(x=\frac{L+U}{2}\) |
| Mean of Ungrouped Data | \(\bar{x}=\frac{\sum x}{n}\) |
| Mean of Grouped Data | \(\bar{x}=\frac{\sum fx}{\sum f}\) |
Main Differences
| Ungrouped Data | Grouped Data |
|---|---|
| Individual values | Groups or class intervals |
| Detailed information | Summarized information |
| Suitable for small datasets | Suitable for large datasets |
| No frequency table is necessary | Frequency table is commonly used |
| Individual values are available | Individual values may be lost |
Important Points to Remember
- Ungrouped data contains separate observations.
- Grouped data contains class intervals and frequencies.
- The sum of all frequencies equals the total observations.
- Class mark is the midpoint of a class interval.
- Grouping makes large datasets easier to understand.
- The mean of grouped data calculated using class marks is generally an estimate.
4. Multiple-Choice Questions (MCQs)
Test your understanding with the following 15 MCQs.
Q1. What is ungrouped data?
A. Data arranged in class intervals
B. Data presented as individual observations
C. Data presented only in percentages
D. Data presented in graphs
Correct Answer: B
Q2. What is grouped data?
A. Data written randomly
B. Data without observations
C. Data organized into groups or class intervals
D. Data containing only one value
Correct Answer: C
Q3. Which type of data is generally suitable for a large collection of observations?
A. Ungrouped data
B. Grouped data
C. Random data
D. None of these
Correct Answer: B
Q4. What is the frequency of a class interval?
A. Its midpoint
B. Its upper limit
C. Number of observations in that interval
D. Difference between its limits
Correct Answer: C
Q5. What is the class mark of the interval 10–20?
A. 10
B. 15
C. 20
D. 30
Correct Answer: B
Q6. Which formula is used to calculate the range?
A. Maximum + Minimum
B. Maximum × Minimum
C. Maximum − Minimum
D. Maximum ÷ Minimum
Correct Answer: C
Q7. Find the range of 5, 10, 15, 20, 25.
A. 15
B. 20
C. 25
D. 30
Correct Answer: B
Q8. Which symbol represents frequency?
A. \(f\)
B. \(x\)
C. \(n\)
D. \(R\)
Correct Answer: A
Q9. What is the mean of 10, 20, and 30?
A. 10
B. 15
C. 20
D. 30
Correct Answer: C
Q10. Which formula is used to calculate the mean of grouped data?
A. \(\frac{\sum x}{n}\)
B. \(\frac{\sum fx}{\sum f}\)
C. \(\frac{\sum f}{\sum x}\)
D. \(X_{\max}-X_{\min}\)
Correct Answer: B
Q11. If the frequencies are 3, 4, and 5, what is the total frequency?
A. 7
B. 8
C. 9
D. 12
Correct Answer: D
Q12. What is the class mark of 20–40?
A. 10
B. 20
C. 30
D. 40
Correct Answer: C
Q13. Which data representation preserves individual observations?
A. Grouped data
B. Ungrouped data
C. Both always lose individual observations
D. Neither
Correct Answer: B
Q14. If the minimum value is 12 and the maximum value is 52, what is the range?
A. 30
B. 35
C. 40
D. 45
Correct Answer: C
Q15. If a frequency distribution contains four classes with frequencies 2, 3, 4, and 6, how many observations are there?
A. 10
B. 12
C. 15
D. 16
Correct Answer: C
5. Student Worksheet / Assignment
Practice Worksheet
15 Questions
Topic: Ungrouped and Grouped Data
Instructions: Attempt all questions. Show complete calculations for numerical problems.
Section A: Definitions and Conceptual Questions
Q1. Define ungrouped data with one suitable example.
Q2. Define grouped data with one suitable example.
Q3. What is meant by frequency in statistics?
Q4. Explain any three differences between grouped data and ungrouped data.
Q5. Why is grouped data useful when dealing with a large collection of observations?
Section B: Basic Numerical Questions
Q6. Find the range of the following ungrouped data:
12, 18, 25, 30, 35, 42, 50
Q7. Find the class mark of each of the following intervals:
a) 0–10
b) 10–20
c) 20–30
d) 30–40
Q8. Calculate the mean of the following ungrouped data:
15, 20, 25, 30, 35
Q9. Find the total frequency of the following distribution:
| Class Interval | Frequency |
|---|---|
| 0–10 | 4 |
| 10–20 | 6 |
| 20–30 | 5 |
| 30–40 | 3 |
Q10. The minimum value of a dataset is 15, and the maximum value is 75. Calculate its range.
Section C: Frequency Distribution and Word Problems
Q11. Convert the following ungrouped data into a grouped frequency distribution using class intervals of width 10:
11, 12, 15, 18, 21, 22, 25, 27, 31, 33, 35, 38
Q12. Calculate the mean of the following grouped data:
| Class Interval | Frequency |
|---|---|
| 0–10 | 2 |
| 10–20 | 4 |
| 20–30 | 3 |
| 30–40 | 1 |
Q13. The marks obtained by eight students are:
20, 25, 30, 35, 40, 45, 50, 55
a) Identify whether the data is grouped or ungrouped.
b) Find its range.
c) Calculate its mean.
Q14. A teacher records the following number of books read by 12 students:
1, 2, 2, 3, 3, 3, 4, 4, 5, 5, 6, 6
Prepare a frequency distribution table showing each number of books and its frequency.
Q15. A school collects information about the marks of 30 students. The teacher organizes the marks into six class intervals and records the number of students in each interval.
a) Is this grouped or ungrouped data?
b) What does frequency represent in this situation?
c) What should be the sum of all frequencies?
Answer Key
Solutions for teachers and self-assessment
Q1. Ungrouped data consists of individual observations presented separately. Example: 5, 10, 15, 20.
Q2. Grouped data consists of observations arranged into groups or class intervals with their frequencies.
Q3. Frequency is the number of observations in a particular value or class interval.
Q4. Any three differences from the comparison table in the article.
Q5. Grouped data summarizes large collections and makes them easier to read, compare, and analyse.
Q6.
\[ R=50-12=\boxed{38} \]
Q7.
a) 5
b) 15
c) 25
d) 35
Q8.
\[ \bar{x}=\frac{15+20+25+30+35}{5} \]
\[ =\frac{125}{5}=\boxed{25} \]
Q9.
\[ N=4+6+5+3=\boxed{18} \]
Q10.
\[ R=75-15=\boxed{60} \]
Q11.
| Class Interval | Frequency |
|---|---|
| 10–20 | 4 |
| 20–30 | 4 |
| 30–40 | 4 |
| Total | 12 |
Q12.
| Class Interval | \(f\) | \(x\) | \(fx\) |
|---|---|---|---|
| 0–10 | 2 | 5 | 10 |
| 10–20 | 4 | 15 | 60 |
| 20–30 | 3 | 25 | 75 |
| 30–40 | 1 | 35 | 35 |
| Total | 10 | 180 |
\[ \bar{x}=\frac{180}{10}=\boxed{18} \]
Q13.
a) Ungrouped data.
b)
\[ R=55-20=\boxed{35} \]
c)
\[ \bar{x}=\frac{20+25+30+35+40+45+50+55}{8} \]
\[ =\frac{300}{8}=\boxed{37.5} \]
Q14.
| Number of Books | Frequency |
|---|---|
| 1 | 1 |
| 2 | 2 |
| 3 | 3 |
| 4 | 2 |
| 5 | 2 |
| 6 | 2 |
| Total | 12 |
Q15.
a) Grouped data.
b) Frequency represents the number of students whose marks fall within a particular class interval.
c) The sum of all frequencies should be 30.
6. Additional FAQs
These additional FAQs address common questions students may search for when studying grouped and ungrouped data.
1. What are the two main forms of data presentation in basic statistics?
The two common forms are grouped data and ungrouped data.
2. What is raw data?
Raw data is information collected in its original form before it is processed, organized, or summarized.
3. Is a frequency distribution table an example of grouped data?
Yes. A frequency distribution table that organizes numerical observations into class intervals is an example of grouped data.
4. What is the relationship between class interval and frequency?
A class interval represents a range of values, while frequency indicates how many observations fall within that range.
5. Does grouping data change the total number of observations?
No. Grouping changes the presentation of data, not the total number of observations. The sum of frequencies remains equal to the total observations.
6. Can grouped data be converted back into ungrouped data?
Generally, the original individual observations cannot be recovered exactly from grouped data because the individual values have been summarized into intervals.
7. What is the difference between a class limit and a class boundary?
Class limits are the stated lowest and highest values of a class, whereas class boundaries are the actual dividing points between consecutive classes in a continuous frequency distribution.
You May be Interested In:
Real Life Application of Loci – Meaning, Examples and Uses in Daily Life
Loci and Construction: Definitions, Rules, Solved Examples, and Class 9 Maths Notes
Altitudes of Triangle: Definition, Properties, Formulas and Solved Examples

Leave a Reply