Graph of Exponential Functions: Examples and Step-by-Step Guide
Introduction
The graph of exponential functions is an important topic in mathematics. It helps students understand how quantities increase or decrease when a variable appears in the exponent of a function.
Exponential functions are used to model population growth, compound interest, the spread of information, radioactive decay, and many other real-life situations.
In this article, you will learn the definition of an exponential function, the basic formulas, the shape and properties of its graph, and how to draw graph of exponential functions using a table of values. You will also find step-by-step solved examples, revision notes, MCQs, and a practice worksheet.
What Is an Exponential Function?
An exponential function is a function in which the independent variable appears in the exponent.
These are exponential functions because the variable (x) appears in the exponent.
Important: The function (y=x^2) is not an exponential function. Here, the variable is the base and the exponent is constant.
Types of Exponential Functions
Exponential functions are commonly classified into two types: exponential growth and exponential decay.
a) Exponential Growth
b) Exponential Decay
Important Properties of the Graph of Exponential Functions
a) Domain
The domain is the set of all real numbers.
This means that (x) can be positive, negative, zero, or a fraction.
b) Range
The output of an exponential function is always positive.
c) Y-Intercept
The graph crosses the y-axis when (x=0).
d) X-Intercept
The graph of (y=a^x) has no x-intercept because (a^x) is always positive.
has no real solution.
e) Horizontal Asymptote
The x-axis, represented by (y=0), is the horizontal asymptote of the standard exponential graph.
The curve approaches the x-axis but does not touch or cross it.
f) Increasing and Decreasing Behaviour
- If (a>1), the graph is increasing from left to right.
- If (0<a<1), the graph is decreasing from left to right.
How to Draw Graph of Exponential Functions
The easiest way to draw an exponential graph is to make a table of values, plot the resulting points, and join them with a smooth curve.
Follow these steps:
- Write the given exponential function.
- Select convenient values of (x), such as (-2,-1,0,1,2).
- Substitute each value into the function.
- Calculate the corresponding values of (y).
- Draw the coordinate axes and choose a suitable scale.
- Plot the ordered pairs ((x,y)).
- Join the points with a smooth curve.
- Check the y-intercept, direction of the curve, and horizontal asymptote.
Diagram-Based Explanation
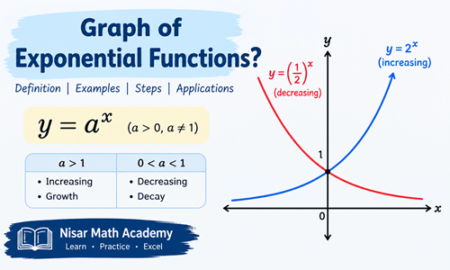
Imagine a coordinate plane with the horizontal x-axis and the vertical y-axis.
For the graph (y=2^x):
- The point ((0,1)) lies on the y-axis.
- The point ((1,2)) is one unit to the right and two units up.
- The point ((2,4)) is two units to the right and four units up.
- On the left side, the graph passes through ((-1,1/2)) and ((-2,1/4)).
- As the curve extends to the left, it approaches the x-axis.
- As the curve extends to the right, it rises increasingly quickly.
The graph is smooth and does not have sharp corners.
For comparison, the graph of (y=(1/2)^x) passes through the same y-intercept ((0,1)), but it decreases from left to right.8. Exponential Functions and Their Real-Life Applications
Exponential functions are useful when a quantity changes by a constant percentage or multiplication factor over equal time intervals.
Related Questions for Practice
Try answering these questions after studying the examples.
- What is an exponential function?
- What is the domain of (y=4^x)?
- What is the range of (y=4^x)?
- Find the y-intercept of (y=5^x).
- Does (y=2^x) have an x-intercept?
- Is (y=(1/3)^x) increasing or decreasing?
- Draw the graph of (y=4^x) using five values of (x).
- Draw the graph of (y=(1/3)^x).
- Find the horizontal asymptote of (y=2^x+4).
- Find the y-intercept of (y=2^x-3).
Mathematics Learning Resources at Nisar Math Academy
Students who want to strengthen their understanding of mathematics can explore Nisar Math Academy at nisarmathacademy.com.
The website provides mathematics video lectures, notes, assessments, lesson plans, worksheets, solved questions, and educational articles. Students studying Class 9 Maths can use available free resources, including selected notes, assessments, and lectures covering a question from each exercise. Additional learning resources and full courses are available through membership.
For students looking for class 9 maths notes, class 9 maths video lectures, or a maths guide for class 9, the academy can be a useful place to continue practising topics from their syllabus.
Conclusion
The graph of exponential functions shows how a quantity changes when the independent variable appears in the exponent. A base greater than 1 produces an increasing graph, while a base between 0 and 1 produces a decreasing graph.
To draw an exponential graph, prepare a table of values, calculate the ordered pairs, plot the points, and join them with a smooth curve. Remember the y-intercept, domain, range, and horizontal asymptote when describing the graph.
Practising different examples will help you recognise exponential growth and decay and understand how exponential functions are used in mathematics and everyday life.
Short Notes for Revision
Graph of Exponential Functions — Revision Notes
Definition
An exponential function has the variable in the exponent.
Important properties
| Property | (y=a^x) |
|---|---|
| Domain | All real numbers |
| Range | (y>0) |
| Y-intercept | ((0,1)) |
| X-intercept | None |
| Horizontal asymptote | (y=0) |
| Shape | Smooth curve |
- Horizontal shift: (h) units to the right when (h>0).
- Vertical shift: (k) units upwards when (k>0).
- Horizontal asymptote: (y=k).
- Domain: all real numbers.
- Range: (y>k).
Steps for drawing an exponential graph
- Write the function.
- Choose values of (x).
- Calculate the corresponding (y)-values.
- Prepare a table of values.
- Plot the ordered pairs.
- Join the points with a smooth curve.
- Identify the intercept and horizontal asymptote.
Quick comparison
| Growth | Decay |
|---|---|
| Base (a>1) | Base (0<a<1) |
| Increasing curve | Decreasing curve |
| Example: (y=2^x) | Example: (y=(1/2)^x) |
Remember: The standard exponential graph never reaches zero, although it can approach the x-axis indefinitely.
Multiple-Choice Questions (MCQs)
Test your understanding of exponential functions. Each question has four options and one correct answer.
Practice quiz
0 of 15 answered
1. Which of the following is an exponential function?A. y = x²B. y = 2ˣC. y = 2x + 1D. y = √x
2. What is the y-intercept of y = 3ˣ?
A. (1, 0)
B. (0, 0)
C. (0, 1)
D. (1, 3)
3. What is the domain of y = 2ˣ?
A. x > 0
B. x ≥ 0
C. All real numbers
D. Only integers
4. What is the range of y = 4ˣ?
A. y ≥ 0
B. y > 0
C. All real numbers
D. y > 1
5. Which function represents exponential decay?
A. y = 3ˣ
B. y = 5ˣ
C. y = (1/2)ˣ
D. y = x³
6. What is the value of 2⁻²?
A. −4
B. −1/4
C. 1/4
D. 4
7. What is the horizontal asymptote of y = 5ˣ?
A. x = 0
B. y = 1
C. y = 0
D. x = 1
8. Which point lies on y = 2ˣ?
A. (0, 0)
B. (1, 2)
C. (2, 2)
D. (−1, −2)
9. What is the y-intercept of y = 2ˣ + 3?
A. (0, 1)
B. (0, 3)
C. (0, 4)
D. (3, 0)
10. What is the horizontal asymptote of y = 2ˣ − 4?
A. y = 0
B. y = 2
C. y = −4
D. x = −4
11. If Q(t) = 10(2)ᵗ, what is Q(3)?
A. 30
B. 60
C. 80
D. 100
12. What happens to y = (1/3)ˣ as x increases?
A. It increases without limit
B. It decreases towards zero
C. It remains constant
D. It becomes negative
13. Which ordered pair is on y = 3ˣ?
A. (0, 3)
B. (1, 1)
C. (2, 9)
D. (−1, −3)
14. What is the range of y = 2ˣ + 2?
A. y > 0
B. y > 2
C. y ≥ 2
D. All real numbers
15. Which method is commonly used to draw an exponential graph by hand?
A. Use a table of values
B. Draw only a straight line
C. Set every y-value to zero
D. Plot only the origin
Student Worksheet / Assignment
Worksheet: Graph of Exponential Functions
Subject: Mathematics
Topic: Graph of Exponential Functions
Instructions: Attempt all questions. Show your working for numerical problems and use graph paper where required.
Section A: Definitions and Concepts
Q1. Define an exponential function and write its general form.
Q2. Differentiate between exponential growth and exponential decay.
Q3. State the domain and range of (y=2^x).
Q4. Explain why the graph of (y=3^x) does not cross the x-axis.
Section B: Formula-Based Questions
Q5. Evaluate:
a. (2^3)
b. (2^{-3})
c. (5^0)
d. ((1/3)^{-2})
Q6. Find the y-intercept and horizontal asymptote of:
[
y=2^x+4
]
Q7. Find the y-intercept, range, and horizontal asymptote of:
[
y=3^x-2
]
Section C: Numerical and Graphing Problems
Q8. Complete the table for (y=2^x).
| (x) | (y=2^x) |
|---|---|
| (-2) | ______ |
| (-1) | ______ |
| (0) | ______ |
| (1) | ______ |
| (2) | ______ |
Q9. Draw the graph of (y=2^x) using the values from Question 8. Mark the y-intercept and horizontal asymptote.
Q10. Prepare a table of values for (y=(1/2)^x) using (x=-2,-1,0,1,2). Draw its graph and state whether it represents growth or decay.
Q11. Find the y-intercept and horizontal asymptote of:
[
y=4^x-3
]
Q12. A quantity starts at 50 and doubles every hour. Write an exponential model and calculate the quantity after four hours.
Section D: Word Problems
Q13. A bank deposit of Rs. 5,000 grows by 10% per year under annual compounding. Assuming the rate remains constant, calculate the amount after two years.
Q14. A substance initially has a mass of 160 grams. Its mass halves after each equal time interval. Write a model for the mass after (t) intervals and calculate the mass after three intervals.
Q15. The graph of an exponential function has the horizontal asymptote (y=3). If it is obtained by shifting (y=2^x) vertically, write one possible equation and state its y-intercept.
Frequently Asked Questions (FAQs)
1. What is the graph of an exponential function?
The graph of an exponential function is a smooth curve. It increases when \(a>1\) and decreases when (0<a<1\).
2. How do you draw a graph of exponential functions?
Make a table of values, calculate the corresponding outputs, plot the ordered pairs, and join them with a smooth curve.
3. What is the general formula for an exponential function?
4. What is the y-intercept of an exponential graph?
5. Does an exponential graph cross the x-axis?
The standard graph \(y=a^x\) does not cross the x-axis because its output is always positive. Vertically shifted exponential graphs may cross the x-axis.
6. What is the horizontal asymptote of an exponential function?
7. What is the difference between exponential growth and decay?
Exponential growth occurs when the base is greater than 1. Exponential decay occurs when the base is between 0 and 1.
8. Where can I find Class 9 Maths notes and video lectures?
Students can visit Nisar Math Academy for available mathematics notes, recorded lectures, assessments, worksheets, and other learning resources.
You May be Interested In:
What Do You Know About the Graph of Reciprocal Functions?
Graph of Cubic Functions: Definition, Examples, and Solved Questions
Graph of Quadratic Functions: Definition, Formula, Examples and Graphs

Leave a Reply