Functions and Their Graphs: Definition, Types, Examples and Basic Graphs
Introduction
Functions are one of the most important concepts in mathematics. They help us describe relationships between two quantities and are widely used in algebra, geometry, science, economics, and many other fields.
A function connects each input with exactly one output. We can represent a function using an equation, a table, ordered pairs, or a graph.
In this article, we will learn about functions and their graphs in a simple, student-friendly way. We will discuss the definition of a function, domain and range, different types of functions, 10 basic functions and their graphs, important formulas, worked examples, common mistakes, applications, MCQs, and practice questions.
What Is a Function?
A function is a relation in which each input has exactly one output.
A function is commonly written as:
Here:
- is the input or independent variable.
- is the output or dependent variable.
- represents the value of the function at .
For example:
If , then:
Therefore, the input produces the output .
What Is the Domain of a Function?
The domain of a function is the set of all allowed input values.
For example, consider:
There is no restriction on , so its domain is all real numbers.
However, consider:
Here cannot be zero because division by zero is undefined.
Therefore:
So the domain is all real numbers except .
What Is the Range of a Function?
The range is the set of all possible output values of a function.
For example:
The square of a real number can never be negative. Therefore:
The range is:
What Is the Graph of a Function?
The graph of a function is a collection of points that satisfy the function.
Suppose:
We can choose some values of and calculate .
| Ordered Pair | ||
|---|---|---|
| -2 | -3 | |
| -1 | -1 | |
| 0 | 1 | |
| 1 | 3 | |
| 2 | 5 |
Plotting these points on the coordinate plane gives the graph of the function.
For a linear function, these points lie on a straight line.
How to Draw the Graph of a Function
The following steps are useful for drawing many basic function graphs.
Step 1: Write the function
For example:
Step 2: Select values of
Choose convenient values such as:
Step 3: Calculate the corresponding -values
| -2 | 4 |
| -1 | 1 |
| 0 | 0 |
| 1 | 1 |
| 2 | 4 |
Step 4: Plot the ordered pairs
Plot:
Step 5: Join the points appropriately
The resulting graph is a U-shaped curve called a parabola.
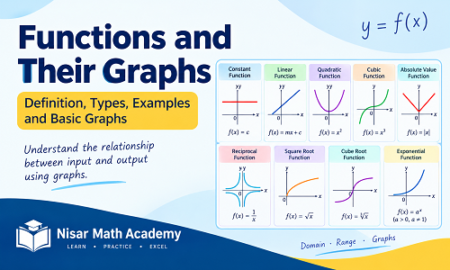
10 Basic Functions and Their Graphs
Learning the basic functions and their graph shapes makes it easier to understand more complicated functions.
1. Constant Function
A constant function has the form:
where is a constant.
Example:
Its graph is a horizontal straight line passing through .
The output remains the same for every input.
Domain: All real numbers
Range:
2. Identity Function
The identity function is:
Its graph is a straight line passing through the origin.
Important points include:
The line has slope:
3. Linear Function
A linear function generally has the form:
where is the slope and is the -intercept.
Example:
Its graph is a straight line.
If , the line rises from left to right.
If , the line falls from left to right.
4. Quadratic Function
A quadratic function has the form:
The simplest quadratic function is:
Its graph is a parabola.
When , the parabola opens upward.
When , it opens downward.
5. Cubic Function
A basic cubic function is:
Its graph has an S-like shape and passes through the origin.
Some points are:
6. Absolute Value Function
The basic absolute value function is:
Its graph has a V-shape.
For example:
The graph is symmetric about the -axis.
7. Reciprocal Function
A basic reciprocal function is:
Its graph consists of two separate branches.
The function is undefined at:
The coordinate axes act as asymptotes:
and
8. Square Root Function
The basic square root function is:
For real-valued outputs, must satisfy:
The graph begins at and extends into the first quadrant.
9. Cube Root Function
The basic cube root function is:
Unlike the square root function, the cube root function is defined for every real number.
Its graph passes through the origin and has an S-like shape.
10. Exponential Function
A basic exponential function can be written as:
where:
For example:
Some values are:
| -2 | |
| -1 | |
| 0 | 1 |
| 1 | 2 |
| 2 | 4 |
The graph passes through:
and remains above the -axis.
Quick Comparison of Basic Functions
| Function | Equation | Typical Graph Shape |
|---|---|---|
| Constant | Horizontal line | |
| Identity | Straight line | |
| Linear | Straight line | |
| Quadratic | Parabola | |
| Cubic | S-shaped curve | |
| Absolute value | (f(x)= | x |
| Reciprocal | Two branches | |
| Square root | Curved half-branch | |
| Cube root | S-shaped curve | |
| Exponential | Increasing/decreasing curve |
Diagram-Based Explanation
When an actual graph cannot be inserted, we can describe its appearance using words.
Graph of
Imagine a coordinate plane. Draw a straight line passing through the origin . The line rises at the same rate as it moves from left to right.
Graph of
Imagine a U-shaped curve with its lowest point at the origin. The left and right sides are mirror images of each other.
Graph of
Imagine the two sides of the letter V meeting at the origin. The graph is symmetric about the -axis.
Graph of
Imagine two separate curved branches. One lies in the first quadrant and the other in the third quadrant. Neither branch touches either coordinate axis.
Important Formulas Related to Functions and Their Graphs
Linear Function
where:
- = slope
- = -intercept
The slope between two points is:
Quadratic Function
The -coordinate of the vertex is:
The corresponding -coordinate is obtained by substituting this value of into the function.
Distance Formula
When studying points on a graph, the distance between:
and
is:
Worked Example 1: Evaluating a Function
Given:
Find .
Solution
Substitute :
Therefore, the point:
lies on the graph of the function.
Worked Example 2: Finding Points for a Graph
Draw the graph of:
Solution
Choose some values of .
| Point | ||
|---|---|---|
| -2 | 0 | |
| -1 | 1 | |
| 0 | 2 | |
| 1 | 3 | |
| 2 | 4 |
Plot these points and join them with a straight line.
Therefore, the graph is a straight line with:
and
Worked Example 3: Graph of a Quadratic Function
Consider:
Find the values of for:
Solution
For :
For :
For :
For :
For :
Therefore, the points are:
These points form a parabola opening upward.
Worked Example 4: Finding the Slope
Find the slope of the line passing through:
and
Solution
Use:
Substitute the values:
Therefore, the slope is .
Worked Example 5: Finding the Domain
Find the domain of:
Solution
The denominator cannot be zero.
Therefore:
So:
Hence, the domain is all real numbers except .
Worked Example 6: Finding the Range
Find the range of:
Solution
We know:
Therefore:
The minimum value is .
Hence, the range is:
or:
How Can You Tell Whether a Graph Represents a Function?
A useful method is the vertical line test.
Imagine drawing vertical lines across a graph.
- If every vertical line touches the graph at most once, the graph represents a function.
- If a vertical line intersects the graph more than once, the graph does not represent as a function of .
For example, a parabola opening upward passes the vertical line test.
A circle does not pass the vertical line test because some vertical lines intersect the circle at two points.
Transformations of Graphs
A graph can be shifted, reflected, stretched, or compressed.
Starting with:
Vertical Shift
moves the graph upward by units when .
Horizontal Shift
moves the graph units to the right.
Reflection in the x-axis
reflects the graph across the -axis.
Reflection in the y-axis
reflects the graph across the -axis.
Understanding these transformations helps students quickly sketch more complicated graphs.
Practical Applications of Functions
Functions are not limited to textbook exercises. They are used to describe relationships in real life.
Distance and Time
If a vehicle travels at a constant speed, distance can be represented as a function of time:
where is speed.
Temperature
A mathematical function can describe how temperature changes with time.
Cost and Quantity
A shop may use a function to represent the total cost of buying a particular number of items.
Population Growth
Exponential functions can be used to model certain types of population growth.
Physics
Functions are widely used to describe motion, velocity, acceleration, and other physical quantities.
Common Mistakes Students Make
1. Confusing Domain and Range
Remember:
- Domain → input values
- Range → output values
2. Forgetting That a Function Has One Output for Each Input
A function may have the same output for different inputs, but one input cannot have two different outputs.
3. Sign Errors
Be careful when calculating:
not .
4. Incorrectly Plotting Ordered Pairs
The first coordinate is , and the second is :
5. Joining Points Incorrectly
Some functions have straight-line graphs, while others have curves. The shape of the graph should match the type of function.
6. Ignoring Restrictions
For:
is not allowed.
For:
real-valued inputs must satisfy:
Common Questions Students Search For
What is a function in mathematics?
A function is a relation in which every input is associated with exactly one output.
What are functions and their graphs?
Functions describe relationships between inputs and outputs, while their graphs visually represent the corresponding ordered pairs on a coordinate plane.
What are the 10 basic functions and their graphs?
Common basic functions include constant, identity, linear, quadratic, cubic, absolute value, reciprocal, square root, cube root, and exponential functions.
How do I draw the graph of a function?
Choose suitable -values, calculate the corresponding -values, plot the ordered pairs, and connect them according to the nature of the function.
What is the difference between domain and range?
The domain contains the allowed input values, while the range contains the resulting output values.
How can I identify a function from its graph?
Use the vertical line test. If no vertical line intersects the graph more than once, the graph represents a function.
Functions and Class 9 Mathematics
Students studying Class 9 mathematics can benefit from understanding functions, graphs, coordinate geometry, algebraic expressions, and related concepts together.
For students looking for class 9 maths notes, solved questions, assessments, worksheets, and recorded lessons, Nisar Math Academy provides mathematics learning resources in an online format. Some Class 9 resources are available freely, while additional course materials are available through website membership.
Students can also use class 9 maths video lectures, notes, and assessments for revision and practice.
Conclusion
Functions provide a powerful way to describe relationships between quantities. A function assigns exactly one output to each input, and its graph provides a visual representation of that relationship.
The most useful basic graphs to recognize include the straight line, parabola, V-shaped absolute-value graph, reciprocal graph, square-root graph, cubic graph, and exponential graph.
By learning the functions and their graphs, domain and range, graphing methods, transformations, and common function types, students can build a strong foundation for more advanced mathematics.
Regular practice with tables, ordered pairs, equations, and graphs is one of the best ways to develop confidence in this topic.
Short Revision Notes
Function
A function is a relation in which every input has exactly one output.
Domain
The domain is the set of all permitted input values.
Range
The range is the set of all possible output values.
Important Basic Functions
| Function | Formula | Graph |
|---|---|---|
| Constant | Horizontal line | |
| Identity | Straight line | |
| Linear | Straight line | |
| Quadratic | Parabola | |
| Cubic | S-shaped curve | |
| Absolute value | (f(x)= | x |
| Reciprocal | Two branches | |
| Square root | Curved graph | |
| Cube root | S-shaped curve | |
| Exponential | Exponential curve |
Important Formulas
Slope:
Linear function:
Quadratic function:
Vertex -coordinate:
Distance between two points:
Vertical Line Test
A graph represents a function if every vertical line intersects it at most once.
10 MCQs on Functions and Their Graphs
1. Which statement correctly defines a function?
A. Every output has exactly one input
B. Every input has exactly one output
C. Every input has at least two outputs
D. Inputs and outputs must always be equal
Correct Answer: B
2. What is the basic identity function?
A.
B.
C.
D.
Correct Answer: C
3. What is the graph of ?
A. Straight line
B. Circle
C. Parabola
D. V-shaped graph
Correct Answer: C
4. Find if:
A. 6
B. 8
C. 10
D. 11
Correct Answer: D
5. What is the domain restriction for:
A.
B.
C.
D.
Correct Answer: C
6. What is the shape of the graph of ?
A. Circle
B. V-shape
C. Parabola
D. Horizontal line
Correct Answer: B
7. What is the slope of the line:
A. 3
B. 4
C. -3
D. -4
Correct Answer: A
8. What is the range of:
for real ?
A.
B.
C.
D. All real values of
Correct Answer: C
9. Which graph has the general shape of a parabola?
A. Linear function
B. Quadratic function
C. Constant function
D. Reciprocal function
Correct Answer: B
10. Which test is commonly used to determine whether a graph represents a function?
A. Horizontal line test
B. Vertical line test
C. Distance test
D. Slope test
Correct Answer: B
Worksheet / Assignment
Part A: Definitions
- Define a function in your own words.
- What is meant by the domain of a function?
- What is meant by the range of a function?
- What is the vertical line test?
Part B: Conceptual Questions
- State the general form of a linear function.
- What is the general shape of the graph of a quadratic function?
- Why is excluded from the domain of ?
- Name four basic functions and state the general shape of each graph.
Part C: Numerical Questions
- If:
find .
- Complete the table for:
using:
- Find the slope of the line passing through:
and
- Find the domain of:
- Find the range of:
for real .
Part D: Word Problems
- A taxi charges a fixed amount of Rs. 100 plus Rs. 50 per kilometre. Write a function for the total cost of travelling kilometres. Find the cost for 6 kilometres.
- The distance travelled by a car moving at a constant speed of 60 km/h is represented by:
where is time in hours. Find the distance travelled in 2.5 hours.
Worksheet Answer Key
- A function is a relation in which each input has exactly one output.
- The domain is the set of permitted input values.
- The range is the set of possible output values.
- The vertical line test determines whether a graph represents a function.
- A parabola.
- Because division by zero is undefined.
- Examples: linear—straight line; quadratic—parabola; absolute value—V-shape; reciprocal—two branches.
Answer: 17
| -2 | 5 |
| -1 | 2 |
| 0 | 1 |
| 1 | 2 |
| 2 | 5 |
Answer: 2
Therefore:
Since:
we have:
Therefore:
The function is:
For 6 km:
Frequently Asked Questions
1. What are functions and their graphs?
A function describes a relationship in which each input has exactly one output. Its graph is the set of corresponding points plotted on a coordinate plane.
2. What are the 10 basic functions and their graphs?
Ten commonly studied basic functions are constant, identity, linear, quadratic, cubic, absolute value, reciprocal, square root, cube root, and exponential functions.
3. What is the easiest way to graph a function?
Make a table of suitable -values, calculate the corresponding -values, plot the ordered pairs, and connect them according to the function’s graph shape.
4. What is the difference between domain and range?
The domain contains the input values, while the range contains the output values.
5. What is the vertical line test?
It is a graphical method for checking whether a graph represents a function. A vertical line must not intersect the graph more than once.
6. What is the graph of a linear function?
The graph of a linear function is a straight line.
7. What is the graph of a quadratic function?
The graph of a quadratic function is a parabola.
8. Where can students find Class 9 mathematics learning resources?
Students can find mathematics notes, recorded lectures, assessments, worksheets, and other learning resources through educational platforms such as Nisar Math Academy.
You May be Interested In:
Applications of Polygons: Uses of Polygons in Our Life with Examples
Ex 12.1 Class 9th – Complete Solution | Class 9 Maths Notes Chapter 12
Geometrical Properties of Parallelograms: Definition, Properties, Formulas and Examples

Leave a Reply