Applications of Graph in Real Life: Examples, Uses and Solved Questions
Introduction
Graphs are important mathematical tools that help us understand information, compare quantities, identify patterns, and solve real-world problems. The applications of graph in real life can be seen in weather forecasting, business, transportation, education, science, engineering, and many other fields.
For example, a line graph can show how temperature changes during a day, while a bar graph can compare the marks obtained by students in different subjects. A distance-time graph can help us understand the movement of a car or a person.
In this article, you will learn what a mathematical graph is, the different types of graphs, the formulas used to interpret them, and how graphs are applied in everyday situations. You will also find solved examples, revision notes, multiple-choice questions, and a practice worksheet.
What Is a Graph in Mathematics?
A graph is a visual representation of information, relationships, or mathematical functions. It helps us understand numerical data more easily than a long list of numbers.
In coordinate geometry, a graph may represent a mathematical relationship between two variables, such as x and y. The points are plotted on the coordinate plane using ordered pairs (x, y).
For example, consider the equation:
y = 2x
When x = 1, y = 2. When x = 2, y = 4. When x = 3, y = 6.
The corresponding points are (1, 2), (2, 4), and (3, 6). Plotting these points and joining them produces a straight line.
Important Parts of a Graph
- Horizontal axis (x-axis): The horizontal reference line on a coordinate plane.
- Vertical axis (y-axis): The vertical reference line on a coordinate plane.
- Origin: The point (0, 0), where the two axes intersect.
- Scale: The intervals used to represent values on an axis.
- Data points: Points that represent specific values or relationships.
- Title: A heading that explains what the graph represents.
- Labels: Words or units that identify the quantities shown on the axes.
Types of Graphs and Their Uses
Different graphs are suitable for different kinds of information.
1. Bar Graph
A bar graph uses rectangular bars to compare categories. The length or height of each bar represents a value.
Real-life example: A teacher compares the number of students who prefer mathematics, science, English, and computer studies.
Best used for: Comparing separate categories.
2. Line Graph
A line graph connects data points with lines to show how a quantity changes, often over time.
Real-life example: A line graph shows the temperature recorded at different times of the day.
Best used for: Showing trends and changes over time.
3. Pie Chart
A pie chart is a circle divided into sectors. Each sector represents a proportion of the whole.
The angle of a sector is calculated using:
Sector angle = (Category value ÷ Total value) × 360°
Real-life example: A student uses a pie chart to show how time is divided among studying, sleeping, playing, and other activities.
Best used for: Showing proportions and percentages.
4. Histogram
A histogram represents the frequency distribution of numerical data grouped into intervals. Its bars normally touch each other because the intervals are continuous.
Real-life example: A school displays how many students scored within different marks intervals in an examination.
Best used for: Understanding the distribution of numerical data.
5. Distance-Time Graph
A distance-time graph shows the distance travelled in relation to the time taken.
Its gradient represents speed when distance and time are measured in consistent units.
Speed = Change in distance ÷ Change in time
Real-life example: A graph shows the distance covered by a bus during a journey.
Best used for: Studying movement and speed.
6. Cartesian Graph
A Cartesian graph plots points using horizontal and vertical axes. It is widely used in algebra, coordinate geometry, and science.
Real-life example: An engineer plots the relationship between the voltage and current in an electrical circuit.
Best used for: Representing equations and relationships between variables.
7. Network Graph
In graph theory, a network graph consists of vertices (or nodes) connected by edges. It is different from a bar graph or a line graph used to display numerical data.
Real-life example: A road map can be represented as a network in which intersections are vertices and roads are edges.
Best used for: Studying connections, routes, communication networks, and relationships.
Applications of Graph in Real Life
Graphs are useful because they convert complex information into a form that is easier to understand and interpret. The following examples explain their practical importance.
1. Graphs in Education
Teachers use graphs to compare examination results, monitor attendance, and analyse students’ performance.
For example, a bar graph can compare the mathematics marks of five students. A line graph can show how a student’s test scores change throughout the academic year.
Students studying Class 9 mathematics can use graphs to understand linear equations, coordinate geometry, and relationships between variables.
2. Graphs in Business and Economics
Businesses use graphs to analyse sales, expenses, profit, customer demand, and production.
For example, a line graph can show monthly sales and help a business identify periods of growth or decline.
Graphs also help economists study inflation, unemployment, population growth, and changes in prices.
3. Graphs in Weather Forecasting
Meteorologists use graphs to represent temperature, rainfall, wind speed, and other weather measurements.
A line graph showing daily temperature can help people identify warmer and cooler periods. A bar graph can compare monthly rainfall in different cities.
These visual representations make weather data easier to compare and interpret.
4. Graphs in Transportation
Graphs are useful for studying the movement of vehicles, travel times, and road networks.
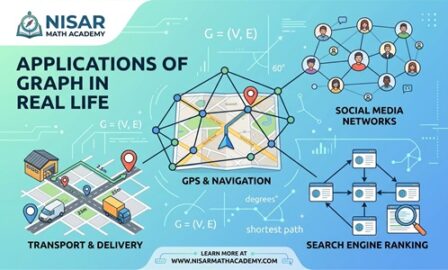
A distance-time graph can show how far a vehicle travels over a period. A network graph can represent roads and intersections, helping route-planning systems analyse possible paths.
For a journey, average speed can be calculated using:
Average speed = Total distance travelled ÷ Total time taken
5. Graphs in Science
Scientists use graphs to identify patterns and relationships in experimental data.
For example, a line graph can show how the temperature of a substance changes as it is heated. A graph of distance against time can help describe motion.
Graphs also help researchers compare observations, test hypotheses, and communicate findings.
6. Graphs in Medicine and Healthcare
Healthcare professionals and researchers use graphs to study patient statistics, compare treatment outcomes, and monitor health-related trends.
For example, a graph can show changes in a patient’s recorded temperature over time or compare the number of reported cases of a disease across several months.
Such graphs help present information clearly, although medical decisions require appropriate professional interpretation.
7. Graphs in Population Studies
Governments and researchers use graphs to study population growth, migration, birth rates, and age distributions.
A line graph can show how the population of a city changes over several years. A bar graph can compare the populations of different cities.
These comparisons can support planning for schools, housing, transportation, and public services.
8. Graphs in Banking and Personal Finance
Graphs can help people understand income, expenses, savings, and changes in account balances.
For example, a bar graph can compare monthly household expenses, while a line graph can show how savings change over time.
Graphs make it easier to identify spending patterns and plan a budget.
9. Graphs in Computer Science and Social Networks
Computer systems use graph theory to represent connections between objects.
In a social network, users can be represented as vertices and their connections as edges. In a computer network, devices can be represented as nodes connected by communication links.
Graph algorithms can help analyse connections, search networks, and identify routes between locations.
10. Graphs in Engineering and Construction
Engineers use graphs to study the relationships between physical quantities, such as force and extension, voltage and current, or load and deformation.
Architects and construction professionals may use coordinate graphs and plotted measurements when planning structures.
Graphs help turn measurements and equations into visual information that can be checked and analysed.
Application of Graph Theory in Real Life
Graph theory is a branch of mathematics that studies networks made up of vertices and edges. It is especially useful when the relationships between objects are more important than their individual numerical values.
Basic Terms in Graph Theory
- Vertex: A point or node in a network.
- Edge: A connection between two vertices.
- Path: A sequence of connected vertices.
- Degree of a vertex: The number of edges incident to that vertex.
- Weighted edge: An edge assigned a value, such as distance, cost, or travel time.
Example: A Simple Road Network
Suppose three towns, A, B, and C, are connected by roads:
- A is connected to B.
- B is connected to C.
- A is connected directly to C.
The vertices are A, B, and C. The edges are AB, BC, and AC.
There are two possible routes from A to C: the direct route AC and the route A–B–C.
If the direct road is 12 km long, the road from A to B is 5 km, and the road from B to C is 4 km, then:
Distance through B = 5 + 4 = 9 km
Direct distance = 12 km
Therefore, the route through B is shorter by:
12 − 9 = 3 km
This example demonstrates how a network graph can help compare routes.
Graph theory is also used in flight networks, internet routing, public transport, logistics, and the study of social relationships.
Formulas Used in Graph Problems
The correct formula depends on the type of graph and the information provided.
1. Gradient of a Straight Line
For two points (x₁, y₁) and (x₂, y₂), the gradient is:
m = (y₂ − y₁) ÷ (x₂ − x₁)
The gradient describes how much y changes for a change in x, provided x₂ ≠ x₁.
2. Equation of a Straight Line
The slope-intercept form is:
y = mx + c
Where:
- m = gradient
- c = y-intercept
3. Speed from a Distance-Time Graph
Average speed = Change in distance ÷ Change in time
4. Percentage
Percentage = (Part ÷ Whole) × 100%
5. Pie Chart Sector Angle
Sector angle = (Category frequency ÷ Total frequency) × 360°
6. Frequency
Frequency is the number of times a particular value or category occurs in a data set.
There is no single formula that applies to every graph. Always identify the graph type and the quantities represented by its axes before selecting a formula.
Step-by-Step Solved Examples
Example 1: Using a Bar Graph to Compare Marks
Five students obtain the following mathematics marks:
| Student | Marks |
|---|---|
| Ali | 65 |
| Sara | 80 |
| Ahmed | 70 |
| Ayesha | 90 |
| Hamza | 75 |
Question: Who obtained the highest marks, and what is the difference between the highest and lowest marks?
Step 1: Identify the highest value.
Highest marks = 90
Step 2: Identify the lowest value.
Lowest marks = 65
Step 3: Calculate the difference.
Difference = 90 − 65 = 25
Answer: Ayesha obtained the highest marks. The difference between the highest and lowest marks is 25.
Graph description: Draw students’ names on the horizontal axis and marks from 0 to 100 on the vertical axis. Draw one bar for each student.
Example 2: Calculating Speed from a Distance-Time Graph
A car travels 60 km in 1 hour and 120 km in 2 hours.
Question: Find the average speed between these two observations.
Step 1: Find the change in distance.
Change in distance = 120 − 60 = 60 km
Step 2: Find the change in time.
Change in time = 2 − 1 = 1 hour
Step 3: Apply the formula.
Average speed = Change in distance ÷ Change in time
Average speed = 60 ÷ 1 = 60 km/h
Answer: The average speed during this interval is 60 km/h.
Example 3: Finding the Gradient of a Graph
A straight line passes through the points A(2, 3) and B(6, 11).
Question: Find its gradient.
Step 1: Write the coordinates.
(x₁, y₁) = (2, 3)
(x₂, y₂) = (6, 11)
Step 2: Use the gradient formula.
m = (y₂ − y₁) ÷ (x₂ − x₁)
Step 3: Substitute the values.
m = (11 − 3) ÷ (6 − 2)
m = 8 ÷ 4
m = 2
Answer: The gradient is 2.
Example 4: Calculating a Pie Chart Sector Angle
A class has 40 students. Twelve students prefer science as their favourite subject.
Question: Find the angle representing science in a pie chart.
Step 1: Identify the category frequency.
Science students = 12
Step 2: Identify the total frequency.
Total students = 40
Step 3: Apply the sector-angle formula.
Sector angle = (12 ÷ 40) × 360°
Sector angle = 0.3 × 360°
Sector angle = 108°
Answer: The science sector should have an angle of 108°.
Example 5: Using a Graph to Calculate Monthly Sales Growth
A shop sells 200 notebooks in January and 260 notebooks in February.
Question: Calculate the percentage increase in sales.
Step 1: Find the increase.
Increase = 260 − 200 = 60 notebooks
Step 2: Divide the increase by the original value.
Percentage increase = (60 ÷ 200) × 100%
Step 3: Calculate the result.
Percentage increase = 0.3 × 100% = 30%
Answer: Notebook sales increased by 30%.
A line graph can show this increase clearly by plotting the monthly sales values.
Example 6: Finding the Equation of a Straight Line from a Graph
A straight line has a gradient of 3 and crosses the y-axis at 2.
Question: Find its equation.
Step 1: Recall the slope-intercept formula.
y = mx + c
Step 2: Identify the gradient and y-intercept.
m = 3 and c = 2
Step 3: Substitute these values.
y = 3x + 2
Answer: The equation is y = 3x + 2.
For example, when x = 2:
y = 3(2) + 2 = 8
Therefore, the point (2, 8) lies on the line.
How to Read and Interpret a Graph
Follow these steps whenever you are asked to interpret a graph.
- Read the title to identify the subject.
- Examine both axes and their labels.
- Check the scale and units.
- Locate the required point, bar, or sector.
- Read the corresponding value carefully.
- Compare values when the question asks for a difference or trend.
- Apply the appropriate formula if a calculation is required.
- Write the answer with the correct units.
Common Mistakes Students Make
1. Ignoring the Scale
A graph may use intervals of 5, 10, or 100. Students sometimes assume that every division represents one unit.
How to avoid it: Check the numerical labels before reading values.
2. Forgetting Units
Writing a speed as 60 instead of 60 km/h leaves out important information.
How to avoid it: Include units such as km, hours, km/h, or degrees where appropriate.
3. Confusing a Bar Graph with a Histogram
Bar graphs compare categories, whereas histograms represent numerical data grouped into intervals.
How to avoid it: Check whether the horizontal axis contains separate categories or continuous numerical intervals.
4. Using the Wrong Formula
Students may use the gradient formula when they need to calculate speed.
How to avoid it: Identify the quantities involved before selecting a formula.
5. Reading the Wrong Point
A point is written as (x, y), with the x-coordinate first and the y-coordinate second.
How to avoid it: Move horizontally to read x, then vertically to read y.
6. Drawing Inaccurate Graphs
Unequal intervals, missing labels, and incorrectly plotted points can lead to wrong answers.
How to avoid it: Choose a suitable scale and plot every point carefully.
How Graphs Help Class 9 Mathematics Students
Graphs are an important part of school mathematics because they connect algebraic expressions with visual representations.
Class 9 students can use graphs to:
- Plot ordered pairs on the Cartesian plane.
- Understand linear equations in two variables.
- Find the gradient and intercepts of straight lines.
- Compare data and interpret trends.
- Solve practical problems involving distance, time, and other quantities.
Students looking for a math lecture class 9, class 9 maths video lectures, or class 9 maths notes can use structured learning resources to practise these skills.
Nisar Math Academy provides mathematics video lectures, notes, assessments, worksheets, lesson plans, and solved questions. Students can explore the available free Class 9 resources, including selected notes and lectures, and review the membership options for additional learning materials.
Frequently Asked Questions
What are the applications of graph in real life?
Graphs are used in education, business, science, transportation, weather forecasting, healthcare, engineering, and finance to present information and identify patterns.
Why are graphs important in mathematics?
Graphs make relationships between quantities easier to visualise. They help students interpret data, understand equations, and solve mathematical problems.
What is the difference between a graph and graph theory?
A mathematical graph can display data or represent a function. Graph theory studies networks made up of vertices and edges and the relationships between them.
Which graph is best for comparing data?
A bar graph is generally suitable for comparing separate categories. A line graph is usually better for showing changes over time.
How is a distance-time graph used in real life?
It shows how distance changes with time. Its gradient represents speed when the axes and units are defined appropriately.
Where is graph theory used?
Graph theory is used in road networks, internet routing, social networks, transport systems, logistics, and other problems involving connections.
Can Class 9 students learn graph applications?
Yes. Class 9 students can begin with coordinate graphs, linear equations, bar graphs, and practical examples involving speed and data.
Where can I find Class 9 maths notes and lectures online?
Students can explore Nisar Math Academy for available mathematics notes, recorded lectures, assessments, worksheets, and other learning resources.
Conclusion
The applications of graph in real life demonstrate how mathematics helps us understand the world. Graphs are used to compare examination marks, analyse sales, study weather patterns, calculate speed, represent scientific relationships, and understand connected networks.
Learning how to select, draw, and interpret different graphs is a useful skill for school mathematics and everyday decision-making. By practising formulas and working through real-life examples, students can develop a stronger understanding of graphs and their practical importance.
3. Short Notes for Revision
Applications of Graph in Real Life — Quick Revision
Definition
A graph is a visual representation of data, mathematical relationships, or connections between objects.
Important Terms
- x-axis: Horizontal axis.
- y-axis: Vertical axis.
- Origin: Point (0, 0).
- Gradient: Rate of change of y with respect to x.
- Vertex: A point in a network graph.
- Edge: A connection between two vertices.
- Scale: The intervals used to represent values.
Types of Graphs
| Graph | Main purpose |
|---|---|
| Bar graph | Comparing categories |
| Line graph | Showing changes over time |
| Pie chart | Showing proportions of a whole |
| Histogram | Showing frequency distributions |
| Distance-time graph | Studying motion |
| Cartesian graph | Representing mathematical relationships |
| Network graph | Representing connections and routes |
Real-Life Applications
- Education: Comparing marks and attendance.
- Business: Analysing sales and profit.
- Weather: Recording temperature and rainfall.
- Transportation: Studying routes and speed.
- Science: Analysing experimental data.
- Healthcare: Monitoring health statistics.
- Finance: Comparing income and expenses.
- Computer science: Representing networks.
Important Differences
- A bar graph compares categories; a histogram represents grouped numerical data.
- A line graph shows trends; a pie chart shows proportions.
- A data graph displays information; graph theory studies vertices, edges, and connections.
Exam Tip
Always check the graph’s title, axes, scale, units, and labels before answering a question. Choose the correct formula and include units in numerical answers.
4. Multiple-Choice Questions (MCQs)
Test your understanding with these 15 questions.
Practice quiz
0 of 15 answered
1. Which graph is generally best for comparing students’ marks in different subjects?
A. Pie chart
B. Bar graph
C. Distance-time graph
D. Network graph
2. Which graph is most suitable for showing temperature changes during a week?
A. Line graph
B. Network graph
C. Pie chart
D. Bar graph only
3. What is the origin of the Cartesian plane?
A. (1, 1)
B. (1, 0)
C. (0, 0)
D. (0, 1)
4. Find the gradient between (1, 2) and (3, 8).
A. 2
B. 3
C. 4
D. 6
5. A car travels 150 km in 3 hours. What is its average speed?
A. 30 km/h
B. 45 km/h
C. 50 km/h
D. 60 km/h
6. A class has 50 students, and 10 prefer science. What is the pie chart angle for science?
A. 36°
B. 60°
C. 72°
D. 90°
7. Which graph is used to represent connections between towns and roads?
A. Pie chart
B. Network graph
C. Histogram
D. Bar graph
8. Which graph normally has adjacent bars representing continuous numerical intervals?
A. Histogram
B. Pie chart
C. Network graph
D. Pictograph
9. If y = 4x + 3, what is the gradient?
A. 3
B. 4
C. 7
D. 12
10. Sales increase from 100 units to 125 units. What is the percentage increase?
A. 15%
B. 20%
C. 25%
D. 30%
11. What does the degree of a vertex represent in an undirected graph?
A. Its position on the x-axis
B. The number of incident edges
C. Its numerical value
D. The total distance travelled
12. A distance-time graph has distance on the vertical axis and time on the horizontal axis. What does its gradient represent?
A. Mass
B. Temperature
C. Speed
D. Area
13. Which graph is most appropriate for showing how a family budget is divided into categories?
A. Pie chart
B. Distance-time graph
C. Network graph
D. Coordinate graph only
14. Which equation represents a straight line with gradient 2 and y-intercept 5?
A. y = 5x + 2
B. y = 2x + 5
C. y = 2x − 5
D. y = x + 5
15. Which of the following is a common use of graph theory?
A. Finding connections in computer networks
B. Measuring every angle with a protractor
C. Calculating only circle areas
D. Converting all fractions into decimals
5. Worksheet / Assignment
Applications of Graph in Real Life — Practice Worksheet
Instructions: Answer all questions. Show your working for numerical problems and include appropriate units.
Section A: Definitions and Concepts
Q1. Define a mathematical graph.
Q2. Write any four parts of a Cartesian graph.
Q3. State two differences between a bar graph and a histogram.
Q4. What are vertices and edges in graph theory? Give one real-life example.
Q5. Name a suitable type of graph for each situation:
a. Comparing the marks of six students.
b. Showing the daily temperature for one week.
c. Representing the percentages of a monthly budget.
Section B: Formula-Based Questions
Q6. Write the formula for finding the gradient of a straight line passing through two points.
Q7. Find the gradient of a line passing through A(2, 4) and B(6, 12).
Q8. Find the equation of a straight line with gradient 5 and y-intercept −2.
Q9. A pie chart represents 25 students out of a total of 100 students. Calculate the sector angle for these students.
Section C: Numerical Problems
Q10. A bus travels 180 km in 4 hours. Calculate its average speed.
Q11. A shop sells 240 items in March and 300 items in April. Calculate the percentage increase in sales.
Q12. A line graph shows the following distances travelled by a cyclist:
| Time (hours) | Distance (km) |
|---|---|
| 1 | 15 |
| 2 | 30 |
| 3 | 45 |
Calculate the average speed over the three-hour period.
Section D: Real-Life Word Problems
Q13. A teacher records the following marks:
| Student | Marks |
|---|---|
| Ali | 70 |
| Sara | 85 |
| Ahmed | 65 |
| Ayesha | 90 |
a. Which graph would be suitable for comparing the marks?
b. Who obtained the highest marks?
c. Find the difference between the highest and lowest marks.
Q14. Three towns A, B, and C are connected by roads. The road from A to B is 7 km, the road from B to C is 6 km, and the direct road from A to C is 16 km.
a. Represent the towns and roads as a network graph.
b. Calculate the distance from A to C through B.
c. How much shorter is this route than the direct road?
Q15. A family spends Rs. 12,000 on food out of a total monthly budget of Rs. 40,000.
a. Calculate the percentage spent on food.
b. Calculate the pie chart sector angle representing food.
c. Name the graph most suitable for showing the proportions of the family budget.
Worksheet Answer Key
Question 1
A visual representation of data, relationships, or mathematical functions.
Question 2
x-axis, y-axis, origin, scale, plotted points, labels (any four).
Question 3
A bar graph compares categories and usually has gaps between bars. A histogram represents grouped numerical intervals and normally has touching bars.
Question 4
A vertex is a node; an edge is a connection between nodes. Example: towns as vertices and roads as edges.
Question 5
a. Bar graph. b. Line graph. c. Pie chart.
Question 6
m = (y₂ − y₁) ÷ (x₂ − x₁), where x₂ ≠ x₁.
Question 7
m = (12 − 4) ÷ (6 − 2) = 8 ÷ 4 = 2.
Question 8
y = mx + c, so y = 5x − 2.
Question 9
(25 ÷ 100) × 360° = 90°.
Question 10
Average speed = 180 ÷ 4 = 45 km/h.
Question 11
Increase = 300 − 240 = 60. Percentage increase = (60 ÷ 240) × 100% = 25%.
Question 12
Average speed = 45 ÷ 3 = 15 km/h.
Question 13
a. Bar graph. b. Ayesha. c. 90 − 65 = 25 marks.
Question 14
a. Three vertices A, B, C with edges AB, BC, AC. b. 7 + 6 = 13 km. c. 16 − 13 = 3 km.
Question 15
a. (12,000 ÷ 40,000) × 100% = 30%. b. 0.30 × 360° = 108°. c. Pie chart.
Copy answer key
6. FAQs for SEO
These FAQs can also be included at the end of the published article.
1. What are the applications of graph in real life?
Graphs are used in education, business, science, weather forecasting, transport, healthcare, finance, and computer networks to present and analyse information.
2. What are the five main uses of graphs?
Graphs help compare values, show changes over time, identify patterns, represent mathematical relationships, and illustrate proportions.
3. Which graph is best for comparing two sets of data?
Bar graphs are useful for comparing categories. Grouped bar graphs can compare two or more data series across the same categories.
4. How are graphs used in daily life?
People use graphs to understand weather forecasts, compare prices, review household expenses, monitor fitness data, and interpret travel information.
5. What is the application of graph theory in real life?
Graph theory is used to model road networks, flight routes, social connections, internet systems, and delivery routes.
6. What is the importance of graphs in Class 9 mathematics?
Graphs help students understand coordinate geometry, ordered pairs, linear equations, and relationships between variables.
8. Where can students find Class 9 maths notes and video lectures?
Students can explore Nisar Math Academy for available Class 9 mathematics notes, recorded video lectures, assessments, worksheets, and other learning resources.
You May be Interested In:
What Do You Know About the Graph of Reciprocal Functions?
Graph of Exponential Functions: Examples and Step-by-Step Guide
Graph of Cubic Functions: Definition, Examples, and Solved Questions

Leave a Reply