Mean, Median and Mode: Definitions, Formulas, Examples and Real-Life Applications
Introduction
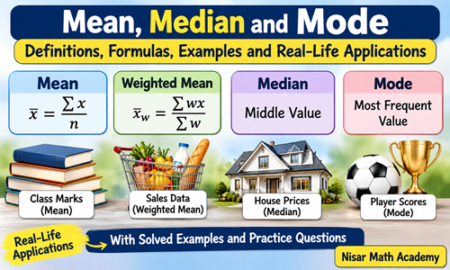
Mean, median and mode are three important measures of central tendency in statistics. They help us understand a collection of numerical data by identifying its average, middle value or most frequently occurring value.
These measures are widely used in everyday life, education, business, sports, healthcare and many other fields. For example, teachers use averages to analyse students’ marks, businesses use them to study sales, and sports analysts use them to compare players’ performances.
In this article, we will learn the definition of mean, median and mode, their formulas, the concept of weighted mean, and how to calculate them through step-by-step solved examples. We will also explore practical situations in which these statistical measures are useful.
1. What Are Mean, Median and Mode?
Mean, median and mode are statistical measures that describe the central position of a data set. They are called measures of central tendency because they indicate a central or representative value of the given data.
1.1 Mean (Arithmetic Mean)
Definition: The mean of a data set is the sum of all observations divided by the total number of observations.
In simple words, the mean is the average of a collection of numbers.
Formula of Mean:
Mean = Sum of all observations / Number of observations
Using mathematical notation:
[
\bar{x}=\frac{\sum x}{n}
]
Where:
- (\bar{x}) = Arithmetic mean
- (\sum x) = Sum of all observations
- (n) = Total number of observations
Example:
Find the mean of 4, 6, 8, 10 and 12.
Solution:
Step 1: Add all the observations.
Sum = 4 + 6 + 8 + 10 + 12 = 40
Step 2: Count the observations.
Number of observations = 5
Step 3: Apply the formula.
Mean = 40 / 5 = 8
Answer: Mean = 8
1.2 Median
Definition: The median is the middle value of a data set when its observations are arranged in ascending or descending order.
The median divides an ordered data set into two equal parts.
There are two cases for finding the median.
Case 1: When the Number of Observations Is Odd
If the number of observations is odd, the median is the middle observation.
Formula:
[
\text{Median}=\left(\frac{n+1}{2}\right)^{th}
\text{ observation}
]
Example:
Find the median of 3, 5, 7, 9 and 11.
Solution:
The observations are already arranged in ascending order.
Number of observations = 5
Median position:
[
\frac{5+1}{2}=3
]
The third observation is 7.
Answer: Median = 7
Case 2: When the Number of Observations Is Even
If the number of observations is even, the median is the average of the two middle observations.
Formula:
[
\text{Median}=
\frac{\left(\frac n2\right)^{th}\text{ observation}
+\left(\frac n2+1\right)^{th}\text{ observation}}{2}
]
Example:
Find the median of 4, 6, 8, 10, 12 and 14.
Solution:
Number of observations = 6
The two middle positions are:
[
\frac 62=3
]
and
[
\frac 62+1=4
]
The third observation is 8, and the fourth observation is 10.
Therefore,
[
\text{Median}=\frac{8+10}{2}
=\frac{18}{2}=9
]
Answer: Median = 9
1.3 Mode
Definition: The mode is the observation that occurs most frequently in a data set.
In simple words, the mode is the value that appears the greatest number of times.
Example:
Find the mode of 2, 3, 4, 4, 5, 6, 4, 7 and 8.
Solution:
The observation 4 occurs three times, while the other observations occur only once.
Therefore, 4 has the highest frequency.
Answer: Mode = 4
A data set may have:
- One mode: When only one value has the highest frequency.
- Two modes: When two values share the highest frequency.
- More than two modes: When several values share the highest frequency.
- No mode: When all observations occur equally often.
2. What Is Weighted Mean?
The weighted mean is a special type of average in which different observations are given different levels of importance, called weights.
Unlike the ordinary arithmetic mean, the weighted mean considers how important or influential each value is.
Definition: The weighted mean is the sum of the products of observations and their corresponding weights divided by the sum of all weights.
Formula of Weighted Mean
[
\bar{x}_w=\frac{\sum wx}{\sum w}
]
Where:
- (\bar{x}_w) = Weighted mean
- (w) = Weight assigned to an observation
- (x) = Corresponding observation
- (\sum wx) = Sum of products of values and weights
- (\sum w) = Sum of all weights
Solved Example: Finding Weighted Mean
A student obtains the following marks in three subjects. The subjects have different weights.
| Subject | Marks (x) | Weight (w) |
|---|---|---|
| Mathematics | 80 | 3 |
| English | 70 | 2 |
| Science | 90 | 1 |
Find the weighted mean.
Solution:
Step 1: Multiply each observation by its weight.
| Marks (x) | Weight (w) | wx |
|---|---|---|
| 80 | 3 | 240 |
| 70 | 2 | 140 |
| 90 | 1 | 90 |
| Total | 6 | 470 |
Step 2: Apply the weighted mean formula.
[
\bar{x}_w=\frac{\sum wx}{\sum w}
]
[
=\frac{470}{6}
]
[
=78.33
]
Answer: Weighted mean = 78.33 (approximately).
This means that the weighted average of the student’s marks is approximately 78.33.
3. Real-Life Situations Involving Mean, Weighted Mean, Median and Mode
Mean, weighted mean, median and mode are not just mathematical concepts. They are useful tools for solving problems in everyday life.
Let us understand their applications through practical situations.
3.1 Mean in Students’ Examination Results
Teachers often calculate the mean to determine the average performance of students in an examination.
Situation:
Five students obtain the following marks in a mathematics test:
60, 70, 80, 90 and 100.
Find the average marks.
Solution:
Step 1: Add all marks.
[
60+70+80+90+100=400
]
Step 2: Divide the sum by the number of students.
[
\text{Mean}=\frac{400}{5}=80
]
Answer: Mean marks = 80.
Real-life application: Teachers can use the mean to understand the overall performance of a class and compare results between different examinations.
3.2 Weighted Mean in Academic Grades
In many educational systems, different assessments carry different percentages or weights.
For example, a student’s final grade may depend on assignments, tests and final examinations.
Situation:
A student obtains:
- Assignment score = 80, weight = 20%
- Test score = 70, weight = 30%
- Final examination score = 90, weight = 50%
Find the weighted average score.
Solution:
Step 1: Multiply each score by its weight.
[
80\times0.20=16
]
[
70\times0.30=21
]
[
90\times0.50=45
]
Step 2: Add the weighted scores.
[
16+21+45=82
]
Answer: Weighted mean = 82.
Real-life application: Educational institutions use weighted averages when different examinations and assessments contribute differently to the final result.
3.3 Median in House Prices
The median is particularly useful when data contains extremely high or low values.
Situation:
The prices of five houses in a neighbourhood are:
Rs. 40 lakh, Rs. 45 lakh, Rs. 50 lakh, Rs. 55 lakh and Rs. 200 lakh.
Find the median house price.
Solution:
Step 1: Arrange the prices in ascending order.
40, 45, 50, 55, 200
Step 2: Find the middle position.
[
\frac{5+1}{2}=3
]
Step 3: Select the third observation.
The third observation is Rs. 50 lakh.
Answer: Median house price = Rs. 50 lakh.
Real-life application: Property dealers and researchers may use the median to describe typical house prices because an unusually expensive property can greatly increase the mean.
3.4 Mode in Shoe Sizes
Retailers use mode to identify the most commonly purchased sizes of products.
Situation:
A shoe shop records the following shoe sizes sold during one day:
6, 7, 8, 7, 9, 8, 7, 10, 8, 7.
Find the mode.
Solution:
Count the frequency of each shoe size.
| Shoe Size | Frequency |
|---|---|
| 6 | 1 |
| 7 | 4 |
| 8 | 3 |
| 9 | 1 |
| 10 | 1 |
The shoe size 7 occurs four times, which is the highest frequency.
Answer: Mode = 7.
Real-life application: Shopkeepers can use the mode to identify the most popular shoe size and make better decisions about stock.
3.5 Mean in Daily Temperature Records
Weather researchers may calculate the mean temperature of a city over several days.
Situation:
The temperatures recorded over five days are:
25°C, 27°C, 28°C, 30°C and 30°C.
Find the mean temperature.
Solution:
[
\text{Mean}=\frac{25+27+28+30+30}{5}
]
[
=\frac{140}{5}=28^\circ C
]
Answer: Mean temperature = 28°C.
Real-life application: Average temperatures help describe general weather conditions over a selected period.
3.6 Median in Employees’ Salaries
Suppose a company has five employees whose monthly salaries are:
Rs. 30,000, Rs. 35,000, Rs. 40,000, Rs. 45,000 and Rs. 150,000.
The median salary is Rs. 40,000.
The mean salary is:
[
\frac{30000+35000+40000+45000+150000}{5}
]
[
=\frac{300000}{5}=60000
]
The mean is Rs. 60,000, while the median is Rs. 40,000.
Real-life application: The median can provide a better picture of a typical salary when a small number of employees earn much higher salaries than others.
3.7 Mode in Customer Preferences
A restaurant records the following customer choices:
Pizza, Burger, Pizza, Sandwich, Pizza, Burger, Pasta, Pizza.
The mode is Pizza because it is selected more frequently than the other items.
Real-life application: Restaurants can use mode to identify popular food items and plan their menus and supplies.
4. Difference Between Mean, Median and Mode
Although all three are measures of central tendency, they are calculated differently and serve different purposes.
| Measure | Meaning | How to Find It |
|---|---|---|
| Mean | Average of observations | Divide their sum by their number |
| Median | Middle value | Arrange data and find the middle |
| Mode | Most frequent value | Find the observation with the highest frequency |
Important Differences
- Mean considers every observation in the data set.
- Median depends on the position of observations after arranging them.
- Mode depends on the frequency of observations.
- Mean can be affected by extremely large or small values.
- Median is generally less affected by extreme values.
- Mode can be used with categorical data, such as favourite colours or food preferences.
5. Mean, Median, Mode and Range
Range is another important statistical measure. It describes the spread of observations by showing the difference between the highest and lowest values.
Definition of Range: The range is the difference between the maximum and minimum observations in a data set.
Formula:
[
\text{Range}=\text{Maximum value}-\text{Minimum value}
]
Example:
Find the range of 5, 8, 10, 12, 15 and 20.
Solution:
Maximum value = 20
Minimum value = 5
[
\text{Range}=20-5=15
]
Answer: Range = 15.
Mean, median and mode describe the central position of data, whereas range describes its spread.
6. Combined Solved Example: Finding Mean, Median, Mode and Range
Find the mean, median, mode and range of the following data:
4, 6, 6, 8, 10, 12, 12, 12.
Solution:
Step 1: Find the Mean
Add all observations:
[
4+6+6+8+10+12+12+12=70
]
Number of observations = 8
[
\text{Mean}=\frac{70}{8}=8.75
]
Step 2: Find the Median
The data is already arranged in ascending order.
Number of observations = 8 (even).
The two middle observations are the fourth and fifth values.
Fourth value = 8
Fifth value = 10
[
\text{Median}=\frac{8+10}{2}=9
]
Step 3: Find the Mode
The observation 12 occurs three times, which is the highest frequency.
[
\text{Mode}=12
]
Step 4: Find the Range
Maximum value = 12
Minimum value = 4
[
\text{Range}=12-4=8
]
Final Answers:
- Mean = 8.75
- Median = 9
- Mode = 12
- Range = 8
7. Diagram-Based Explanation of Mean, Median and Mode
A number line can help students understand the central position of data.
Consider the observations:
2, 4, 4, 6, 8, 8, 8, 10.
Imagine marking these numbers on a horizontal number line.
- Mean represents the arithmetic average of all the observations.
- Median represents the middle position when the observations are arranged in order.
- Mode represents the value that appears most frequently.
For this data:
[
\text{Mean}=\frac{50}{8}=6.25
]
[
\text{Median}=\frac{6+8}{2}=7
]
[
\text{Mode}=8
]
The three measures have different values because they describe the data in different ways.
8. Common Mistakes Students Make
Students should avoid the following mistakes when solving questions involving mean, median and mode.
1. Not Arranging Data Before Finding the Median
Always arrange observations in ascending or descending order before finding the median.
2. Dividing the Sum by the Wrong Number
For mean, count all observations carefully before dividing their sum.
3. Confusing Frequency with Value
The mode is the observation with the highest frequency, not the highest numerical value.
4. Forgetting Weights in Weighted Mean
Always multiply each observation by its corresponding weight before adding the products.
5. Using Only One Middle Value for Even Data
When the number of observations is even, calculate the average of the two middle observations.
6. Confusing Range with Mean
Range is the difference between the highest and lowest values, whereas mean is the average.
9. Frequently Asked Questions
What is mean, median and mode?
Mean is the average of observations, median is the middle value of ordered data, and mode is the most frequently occurring observation.
How do you calculate the mean?
Add all observations and divide their sum by the total number of observations.
How do you find the median of an even number of observations?
Arrange the observations in order and calculate the average of the two middle values.
Can a data set have two modes?
Yes. A data set can have two modes when two observations share the highest frequency.
What is the difference between mean and weighted mean?
The ordinary mean gives equal importance to all observations, whereas the weighted mean assigns different levels of importance to different observations.
Which measure is best for data containing extreme values?
The median is often more suitable because it is less affected by extremely high or low observations.
What is the formula for range?
Range = Maximum observation − Minimum observation.
10. Conclusion
Mean, median, mode and weighted mean are important statistical concepts that help us understand and analyse numerical data. Mean provides an average, median identifies the middle value, mode shows the most frequent observation, and weighted mean considers the relative importance of different values.
These measures have practical applications in education, business, sports, weather records and everyday decision-making.
Students should practise different types of numerical and word problems to develop a strong understanding of these concepts.
For additional mathematics learning resources, Nisar Math Academy provides Class 9 Maths Notes, recorded video lectures, solved questions, worksheets, lesson plans and assessments. Students can explore the available free resources and access complete learning materials through website membership at www.nisarmathacademy.com.
3. Short Notes for Revision
Short Notes: Mean, Weighted Mean, Median and Mode
1. Mean
Definition: Mean is the sum of all observations divided by their total number.
Formula:
[
\bar{x}=\frac{\sum x}{n}
]
2. Weighted Mean
Definition: Weighted mean is an average in which different observations are assigned different weights.
Formula:
[
\bar{x}_w=\frac{\sum wx}{\sum w}
]
3. Median
Definition: Median is the middle value of observations arranged in ascending or descending order.
For odd number of observations:
[
\text{Median position}=\frac{n+1}{2}
]
For even number of observations:
[
\text{Median}=\frac{\text{Two middle observations’ sum}}{2}
]
4. Mode
Definition: Mode is the observation that occurs most frequently.
A data set may have one mode, two modes, more than two modes, or no mode.
5. Range
Definition: Range is the difference between the maximum and minimum observations.
Formula:
[
\text{Range}=\text{Maximum}-\text{Minimum}
]
6. Important Differences
| Mean | Median | Mode |
|---|---|---|
| Average value | Middle value | Most frequent value |
| Uses all observations | Uses ordered positions | Uses frequencies |
| Affected by extreme values | Less affected by extreme values | Identifies the most common value |
7. Important Points to Remember
- Arrange data before finding the median.
- Count all observations before calculating the mean.
- The most frequent observation is the mode.
- Use weights when calculating weighted mean.
- The range measures the spread of data.
- Mean, median and mode are measures of central tendency.
4. Multiple-Choice Questions (MCQs)
MCQs: Mean, Weighted Mean, Median and Mode
Q1. What is the mean of 4, 6, 8 and 10?
A. 6
B. 7
C. 8
D. 9
Correct Answer: B. 7
Q2. Which measure represents the middle value of an ordered data set?
A. Mean
B. Range
C. Median
D. Mode
Correct Answer: C. Median
Q3. Find the mode of 2, 3, 3, 4, 5, 3 and 6.
A. 2
B. 3
C. 4
D. 6
Correct Answer: B. 3
Q4. What is the median of 5, 7, 9, 11 and 13?
A. 7
B. 8
C. 9
D. 11
Correct Answer: C. 9
Q5. What is the median of 2, 4, 6 and 8?
A. 4
B. 5
C. 6
D. 7
Correct Answer: B. 5
Q6. Which formula is used to calculate the arithmetic mean?
A. Sum of observations × Number of observations
B. Sum of observations / Number of observations
C. Maximum − Minimum
D. Highest frequency / Total observations
Correct Answer: B. Sum of observations / Number of observations
Q7. What is the weighted mean of 10 and 20 with weights 2 and 3 respectively?
A. 12
B. 14
C. 15
D. 16
Correct Answer: B. 16
Q8. Which measure is generally more suitable when data contains extreme values?
A. Mean
B. Median
C. Range
D. Weighted mean
Correct Answer: B. Median
Q9. What is the range of 5, 10, 15, 20 and 25?
A. 15
B. 20
C. 25
D. 30
Correct Answer: B. 20
Q10. A data set has two values that share the highest frequency. What is it called?
A. Unimodal
B. Bimodal
C. No mode
D. Mean
Correct Answer: B. Bimodal
Q11. Which measure identifies the most frequently purchased shoe size?
A. Mean
B. Median
C. Mode
D. Range
Correct Answer: C. Mode
Q12. Find the mean of 10, 20, 30, 40 and 50.
A. 20
B. 25
C. 30
D. 35
Correct Answer: C. 30
Q13. If the sum of 8 observations is 120, what is their mean?
A. 12
B. 15
C. 18
D. 20
Correct Answer: B. 15
Q14. Which measure assigns different importance to different observations?
A. Median
B. Mode
C. Range
D. Weighted mean
Correct Answer: D. Weighted mean
Q15. If all observations in a data set are equal, which statement is correct?
A. Mean, median and mode are equal.
B. Mean is always greater than median.
C. Mode does not exist.
D. Median is always zero.
Correct Answer: A. Mean, median and mode are equal.
5. Student Worksheet / Assignment
Worksheet / Assignment
Topic: Mean, Weighted Mean, Median and Mode
Subject: Mathematics
Instructions: Attempt all questions. Show complete working for numerical problems.
Section A: Definitions
Q1. Define arithmetic mean.
Q2. Define median.
Q3. What is mode?
Section B: Conceptual Questions
Q4. Differentiate between mean, median and mode.
Q5. Why must observations be arranged before finding the median?
Q6. What is weighted mean? Write its formula.
Q7. Which measure of central tendency is generally more appropriate for describing house prices when a few houses are extremely expensive? Give a reason.
Section C: Formula-Based Questions
Q8. Write the formula for finding the mean of ungrouped data.
Q9. Write the formula for finding the median when the number of observations is even.
Q10. Write the formula for calculating range.
Section D: Numerical Problems
Q11. Find the mean of the following observations:
12, 14, 16, 18, 20.
Q12. Find the median of:
7, 9, 11, 13, 15, 17.
Q13. Find the mode of:
3, 5, 5, 6, 7, 5, 8, 9.
Q14. Find the weighted mean of the following data:
| Value (x) | Weight (w) |
|---|---|
| 20 | 2 |
| 30 | 3 |
| 40 | 5 |
Q15. A teacher records the marks of eight students:
5, 6, 7, 7, 8, 9, 9, 9.
Find:
a. Mean
b. Median
c. Mode
d. Range
Answer Key
Section A
Q1. Mean is the sum of all observations divided by the total number of observations.
Q2. Median is the middle value of observations arranged in ascending or descending order.
Q3. Mode is the observation that occurs most frequently.
Section B
Q4. Mean is the average, median is the middle value, and mode is the most frequently occurring value.
Q5. Arranging observations helps identify the correct middle position.
Q6. Weighted mean is an average in which different observations are assigned different weights.
[
\bar{x}_w=\frac{\sum wx}{\sum w}
]
Q7. Median, because it is less affected by extremely high house prices.
Section C
Q8.
[
\bar{x}=\frac{\sum x}{n}
]
Q9.
[
\text{Median}=
\frac{\text{Two middle observations’ sum}}{2}
]
Q10.
[
\text{Range}=\text{Maximum}-\text{Minimum}
]
Section D
Q11.
[
\text{Mean}=\frac{12+14+16+18+20}{5}
]
[
=\frac{80}{5}=16
]
Answer: 16
Q12.
There are six observations.
Middle observations = 11 and 13.
[
\text{Median}=\frac{11+13}{2}=12
]
Answer: 12
Q13.
The observation 5 occurs three times.
Answer: Mode = 5
Q14.
| x | w | wx |
|---|---|---|
| 20 | 2 | 40 |
| 30 | 3 | 90 |
| 40 | 5 | 200 |
| Total | 10 | 330 |
[
\bar{x}_w=\frac{330}{10}=33
]
Answer: Weighted mean = 33
Q15.
Given data:
5, 6, 7, 7, 8, 9, 9, 9.
a. Mean:
[
\frac{5+6+7+7+8+9+9+9}{8}
=\frac{60}{8}=7.5
]
b. Median:
[
\frac{7+8}{2}=7.5
]
c. Mode = 9
d. Range:
[
9-5=4
]
Final Answers:
- Mean = 7.5
- Median = 7.5
- Mode = 9
- Range = 4
6. FAQs for SEO
These FAQs can also be included at the end of the published article.
1. What is mean, median and mode in mathematics?
Mean is the average of observations, median is the middle value of ordered observations, and mode is the most frequently occurring value.
2. How do you find mean, median and mode?
Find the mean by dividing the sum by the number of observations, the median by arranging data and identifying the middle value, and the mode by identifying the highest-frequency observation.
3. What is the formula of mean?
The formula is:
[
\bar{x}=\frac{\sum x}{n}
]
4. What is the formula of weighted mean?
The formula is:
[
\bar{x}_w=\frac{\sum wx}{\sum w}
]
5. What is the difference between mean, median and mode?
Mean represents the average, median represents the middle value, and mode represents the most frequent value.
6. Can a data set have more than one mode?
Yes. A data set can have two or more modes if multiple observations share the highest frequency.
7. What is the relationship between mean, median, mode and range?
Mean, median and mode describe the central tendency of data, while range measures the difference between the highest and lowest observations.
You May be Interested In:
Measures of Central Tendency – Definition, Types, Formulas and Solved Examples
Ungrouped and Grouped Data: Definitions, Differences and Examples
Real Life Application of Loci – Meaning, Examples and Uses in Daily Life

Leave a Reply