Solution of Linear Inequality in Two Variables | Solving Linear Inequality Graphically
Introduction
A linear inequality in two variables is an inequality involving two variables, usually represented by (x) and (y), where the highest power of each variable is 1. Linear inequalities are an important topic in algebra because they help us describe a region of possible solutions rather than just a single point or line.
In this article, we will learn the solution of linear inequality in two variables, how to represent its solution graphically, and how to identify the correct region of the graph.
Students preparing for Class 9 Mathematics can use these notes for revision and practice. Nisar Math Academy provides recorded lectures, mathematics notes, assessments, lesson plans, and other useful learning material for students.
What Is a Linear Inequality in Two Variables?
An inequality containing two variables with their highest powers equal to 1 is called a linear inequality in two variables.
Examples include:
[
x+y>5
]
[
2x-y\leq 4
]
[
3x+2y\geq 6
]
[
y<2x+3
]
The symbols used in linear inequalities are:
- (>) means greater than
- (<) means less than
- (\geq) means greater than or equal to
- (\leq) means less than or equal to
Important Difference Between Equality and Inequality
Students sometimes use the phrase linear equality when they actually mean linear inequality.
A linear equation contains an equality sign:
[
2x+y=6
]
A linear inequality contains an inequality sign:
[
2x+y\leq6
]
Therefore, for this topic, the correct mathematical term is linear inequality.
If you search for “solve the following linear equality,” remember that many textbooks and websites may actually be referring to solving a linear equation. For this lesson, our focus is specifically on linear inequalities in two variables.
General Form of a Linear Inequality
A linear inequality in two variables can generally be written as:
[
ax+by<c
]
or
[
ax+by>c
]
or
[
ax+by\leq c
]
or
[
ax+by\geq c
]
where (a), (b), and (c) are constants.
How to Solve a Linear Inequality in Two Variables
To solve a linear inequality graphically, we can follow these basic steps:
Step 1: Replace the Inequality Sign with an Equality Sign
Suppose we have:
[
x+y\leq4
]
First replace (\leq) with (=):
[
x+y=4
]
This gives us the boundary line.
Step 2: Draw the Boundary Line
Plot the line:
[
x+y=4
]
The boundary line separates the coordinate plane into two regions.
Step 3: Decide Whether the Boundary Line Is Included
The inequality sign tells us whether the boundary line is included in the solution.
For:
[
x+y\leq4
]
the line is included because the inequality contains the symbol (\leq). Therefore, we draw the boundary line as a solid line.
For:
[
x+y<4
]
the boundary line is not included. Therefore, we draw it as a dashed line.
Step 4: Choose a Test Point
Choose a convenient point that is not on the boundary line. The origin ((0,0)) is often a useful choice.
For:
[
x+y\leq4
]
put (x=0) and (y=0):
[
0+0\leq4
]
[
0\leq4
]
This statement is true.
Therefore, the region containing ((0,0)) is the solution region.
Step 5: Shade the Solution Region
Finally, shade the side of the boundary line that satisfies the inequality.
Thus, the shaded region represents all ordered pairs ((x,y)) that satisfy the given inequality.
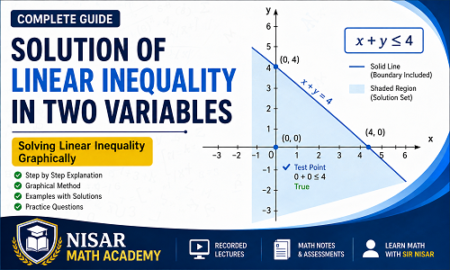
Graphical Solution of (x+y\leq4)
Consider:
[
x+y\leq4
]
The boundary equation is:
[
x+y=4
]
or
[
y=4-x
]
The required graph consists of the boundary line and the region satisfying the inequality.
The shaded region represents the solution set of the inequality.
Example 1: Solve (x+y\leq5) Graphically
Given:
[
x+y\leq5
]
Step 1: Find the Boundary Equation
Replace (\leq) with (=):
[
x+y=5
]
Therefore:
[
y=5-x
]
Step 2: Draw the Boundary Line
The equation (x+y=5) represents a straight line.
Because the inequality is (\leq), the boundary line is included. Hence, we use a solid line.
Step 3: Test the Origin
Take:
[
(0,0)
]
Substitute into the inequality:
[
0+0\leq5
]
[
0\leq5
]
This is true.
Therefore, the region containing the origin is shaded.
Answer
The required solution is the region on and below the line:
[
x+y=5
]
Example 2: Solve (2x+y>4) Graphically
Given:
[
2x+y>4
]
Step 1: Find the Boundary Equation
Replace (>) with (=):
[
2x+y=4
]
Therefore:
[
y=4-2x
]
Step 2: Draw the Boundary Line
Because the inequality is (>), the boundary line is not included. Therefore, draw it using a dashed line.
Step 3: Test the Origin
Put (x=0) and (y=0):
[
2(0)+0>4
]
[
0>4
]
This is false.
Therefore, the region containing the origin is not the solution region.
We shade the opposite side of the boundary line.
Example 3: Solve (y\geq2x+1)
Given:
[
y\geq2x+1
]
The boundary equation is:
[
y=2x+1
]
Since the inequality contains (\geq), the boundary line is included. Therefore, we draw a solid line.
The solution consists of the region on and above the line.
Solid Line and Dashed Line
This is one of the most important points when solving linear inequalities graphically.
Solid Line
Use a solid line when the inequality is:
[
\leq
]
or
[
\geq
]
For example:
[
x+y\leq6
]
and
[
2x-y\geq3
]
The boundary line is included in the solution.
Dashed Line
Use a dashed line when the inequality is:
[
<
]
or
[
]
For example:
[
x+y<6
]
and
[
2x-y>3
]
The boundary line is not included in the solution.
How to Solve Linear Inequality Graphically
A simple method for solving linear inequalities graphically is:
1. Write the given inequality.
2. Replace the inequality sign with (=) to obtain the boundary line.
3. Draw the boundary line.
4. Use a solid line for (\leq) or (\geq).
5. Use a dashed line for (<) or (>).
6. Select a test point.
7. Substitute the test point into the original inequality.
8. If the statement is true, shade the region containing the test point.
9. If the statement is false, shade the opposite region.
How to Solve Linear Inequality Graphically: Quick Example
Suppose:
[
y<2x+3
]
The boundary line is:
[
y=2x+3
]
Since the inequality is (<), draw a dashed line.
Now take the origin:
[
(0,0)
]
Substitute:
[
0<2(0)+3
]
[
0<3
]
This is true.
Therefore, shade the region containing the origin.
This gives the graphical solution of the inequality.
Common Mistakes While Solving Linear Inequalities
Students should avoid the following mistakes:
Mistake 1: Using a Solid Line for Every Inequality
A solid line is not used for (<) and (>).
Remember:
[
\leq,\geq \rightarrow \text{solid line}
]
[
<,> \rightarrow \text{dashed line}
]
Mistake 2: Testing a Point on the Boundary
The test point should normally not lie on the boundary line because it will not help us decide which side to shade.
Mistake 3: Forgetting the Original Inequality
The test point should be substituted into the original inequality, not just the boundary equation.
Mistake 4: Shading the Wrong Region
Always check the test point carefully before shading.
Mistake 5: Confusing Equation and Inequality
Remember:
[
x+y=5
]
represents a line, while
[
x+y\leq5
]
represents a region bounded by a line.
Short Notes on Linear Inequality in Two Variables
- A linear inequality contains two variables whose highest powers are 1.
- Examples are (x+y>3), (2x-y\leq5), and (y\geq x+2).
- To graph an inequality, first find its boundary line.
- Replace the inequality sign by (=) to obtain the boundary equation.
- Use a solid line for (\leq) and (\geq).
- Use a dashed line for (<) and (>).
- A test point helps determine which side of the boundary line should be shaded.
- If the test point satisfies the inequality, shade its region.
- If the test point does not satisfy the inequality, shade the opposite region.
- The shaded region represents the solution set.
- “Linear inequality” is the correct term for this topic; “linear equality” is generally not the intended term.
MCQs on Linear Inequality in Two Variables
MCQ 1
Which of the following is a linear inequality in two variables?
A. (x^2+y=5)
B. (x+y<5)
C. (xy=6)
D. (x^2+y^2=9)
Answer: B. (x+y<5)
MCQ 2
Which symbol represents “less than or equal to”?
A. (>)
B. (<)
C. (\leq)
D. (\geq)
Answer: C. (\leq)
MCQ 3
Which type of line is used for (x+y\leq5)?
A. Dashed line
B. Solid line
C. Curved line
D. Vertical line only
Answer: B. Solid line
MCQ 4
Which type of line is used for (x+y>5)?
A. Solid line
B. Dashed line
C. Circle
D. Curve
Answer: B. Dashed line
MCQ 5
What is the boundary equation of (2x+y\leq6)?
A. (2x+y<6)
B. (2x+y>6)
C. (2x+y=6)
D. (2x+y\geq6)
Answer: C. (2x+y=6)
MCQ 6
Why is a test point used?
A. To find the title of the graph
B. To determine which region satisfies the inequality
C. To change the inequality into an equation
D. To remove the variables
Answer: B. To determine which region satisfies the inequality
MCQ 7
For (y\geq x+2), the boundary line is:
A. (y>x+2)
B. (y=x+2)
C. (y<x+2)
D. (y\leq x+2)
Answer: B. (y=x+2)
MCQ 8
If a test point makes the inequality false, what should we do?
A. Shade the region containing the point
B. Do not draw the boundary
C. Shade the opposite region
D. Change the inequality
Answer: C. Shade the opposite region
MCQ 9
Which inequality includes its boundary line?
A. (x+y<4)
B. (x+y>4)
C. (x+y\leq4)
D. (x+y\neq4)
Answer: C. (x+y\leq4)
MCQ 10
The graphical solution of a linear inequality in two variables is generally:
A. A single point
B. A region of the coordinate plane
C. Only a number
D. A circle
Answer: B. A region of the coordinate plane
Worksheet / Assignment
Part A: Identify the Inequalities
Identify which of the following are linear inequalities in two variables:
- (x+y<8)
- (x^2+y=4)
- (3x-2y\geq7)
- (xy<5)
- (2x+y\leq9)
Part B: Write the Boundary Equation
Find the boundary equation of each inequality:
- (x+y<6)
- (2x+y\geq8)
- (3x-y\leq5)
- (y>2x+1)
- (x-2y<4)
Part C: Identify Solid or Dashed Line
State whether the boundary line should be solid or dashed:
- (x+y\leq7)
- (x-y>3)
- (2x+y<6)
- (y\geq3x-2)
- (4x-y\leq10)
Part D: Solve Graphically
Solve the following inequalities graphically:
- (x+y\leq4)
- (x+y>3)
- (2x+y\leq6)
- (y\geq x+1)
- (y<2x+4)
For each question:
- Find the boundary equation.
- Draw the boundary line.
- Decide whether the line is solid or dashed.
- Select a suitable test point.
- Shade the correct region.
- Write the final solution.
Answers to Worksheet
Part A
- Linear inequality
- Not a linear inequality
- Linear inequality
- Not a linear inequality
- Linear inequality
Part B
- (x+y=6)
- (2x+y=8)
- (3x-y=5)
- (y=2x+1)
- (x-2y=4)
Part C
- Solid
- Dashed
- Dashed
- Solid
- Solid
Conclusion
The solution of a linear inequality in two variables is represented graphically by a region of the coordinate plane. The most important steps are to find the boundary line, decide whether it should be solid or dashed, use a test point, and shade the correct region.
Learning how to solve linear inequality graphically becomes much easier when these steps are followed systematically. Students should practice different types of inequalities to develop confidence in identifying the correct solution region.
For more mathematics learning resources, students can visit Nisar Math Academy, where they can find recorded lectures, notes, assessments, lesson plans, and other educational material. Free resources are also available, while membership provides access to the complete course.
You May be Interested In:
Linear Equations and Inequalities – Complete Notes, Examples, MCQs & Worksheet
How to Find Least Common Multiple (LCM) Using Factorization | Real World Problems of Factorization

Leave a Reply